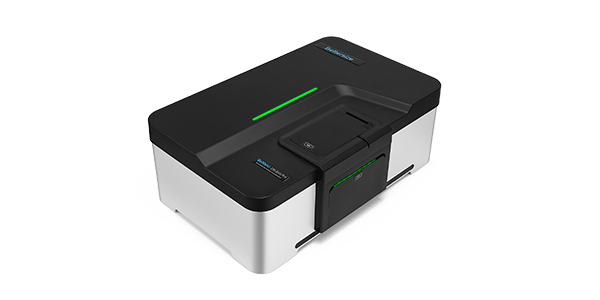
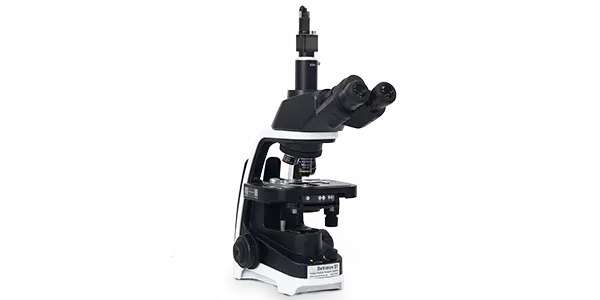
BeNano 180 Zeta Pro
The BeNano Series is the latest generation of nanoparticle size and zeta potential analyzers designed by Bettersize Instruments. Dynamic light scattering (DLS), electrophoretic light scattering (ELS), and static light scattering (SLS) are integrated into the system to provide accurate measurements of particle size, zeta potential, and molecular weight. The BeNano Series is widely applied in academic and manufacturing processes of various fields including but not limited to: chemical engineering, pharmaceuticals, food and beverage, inks and pigments, and life science, etc.
Features and Benefits
- ● Size range: 0.3nm - 15μm
- ● Minimum sample volume: 3μL
- ● APD (Avalanche Photodiode) detector providing exceptional sensitivity
- ● Automatic adjustment of laser intensity
- ● Intelligent algorithm of result evaluation
- ● DLS backscattering (173°) detection technology
- ● User-adjustable scattering volume for concentrated samples
- ● PALS (Phase Analysis Light Scattering) technology
- ● Programmable temperature control system
- ● Compliance with 21 CFR Part 11, ISO 22412, ISO 13099
Video
Enhanced Size Resolution with DLS Flow Mode 
BeNano 90 Zeta | Demo (Polystyrene Standard Sample) 
Fundamentals of BeNano 90 Zeta 
BeNano 90 Zeta | Nanoparticle size and zeta potential analyzer 
BeNano Series | Customer Perspective & Demo 
Understanding the DLS Backscattering Technology 
Book a Free Demo with Global Distributors 
BeNano 180 Zeta Pro | Demo (Polystyrene Latex Sample) 
BeNano 180 Zeta Pro | Nanoparticle size and zeta potential analyzer 
BeNano 180 Zeta Pro Launch Event | Nanoparticle size and zeta potential analyzer 
4 Questions Nanoparticle Researchers are Really Asking About 
Fundamentals of BeNano 180 Zeta Pro 
Fundamentals of BAT 1 Autotitrator 
Fundamentals of DLS Microrheology 
How to Measure Microrheological Properties of Liquids by BeNano? 
How to Operate BAT 1 Autotitrator to Measure Zeta Potential vs. pH 
Fundamentals of BeNano 180 Zeta Pro 
Overview
Features
Software
Technology
Specification
Accessory
Unlock Greater Research Potential With BeNano
- Advanced ELS Technology: PALS
PALS technology can effectively distingguish and extract the electrophoretic behavior even for sample with weak eletrophoretic mobilities, either close to isoelectrical point or with high salinity environment.
- Advanced DLS Technology: Backscattering Detection
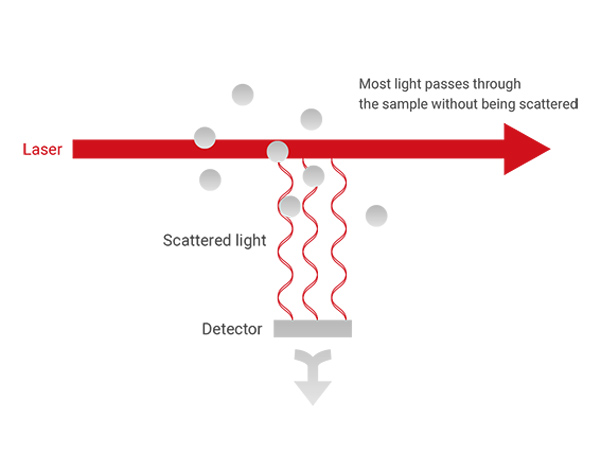
Backscattering DLS optics can detect much larger scattering volume compared to 90-degree optics. Combined with movable measurement position, backscattering DLS offers much higher sensitivity and high turbidity sample measurement capacity.
- Temperature Trend Measurement
For thermal sensitive samples, a temperature trend can be performed easily with a programmed SOP. The BeNano can detect the temperature transition point of the size results, which is the aggregation temperature for protein samples.
- Stable and Durable Optical Bench
The BeNano adopts a 50mW solid-state laser, a singlemode fiber system and a high-performance APD detector, providing stable, wide-ranging, and highly redundant detection capabilities.
- Research Level Software
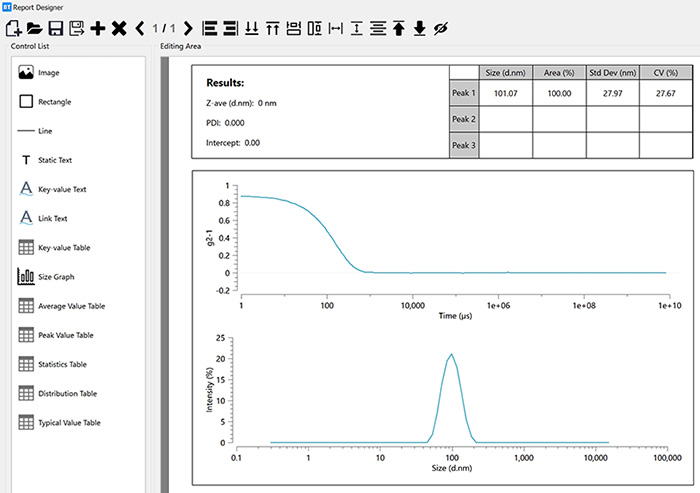
The BeNano software can evaluate and process scattered light signals intelligently to improve the signal quality and result stability. Various built-in calculation modes can cover multiple scientific research and application fields.
- Ultra Low Sample Volume Required
Measuring trace amount of sample is required for earlystage R&D in pharmaceutical industy and academia. With the capillary sizing cell, only 3 to 5 μL of sample is needed for precise size measurement.
1. Particle Size Measured by Dynamic Light Scattering (DLS)
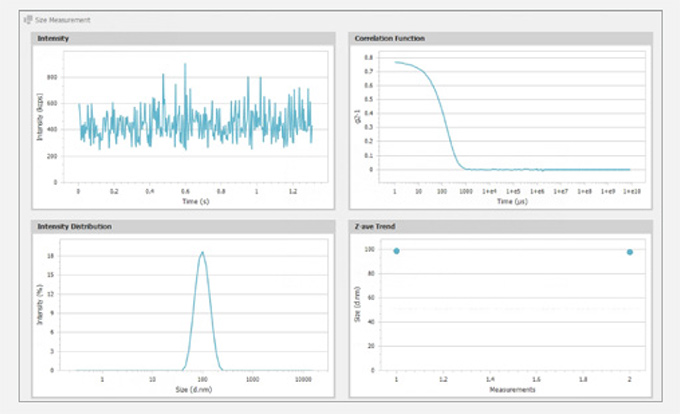
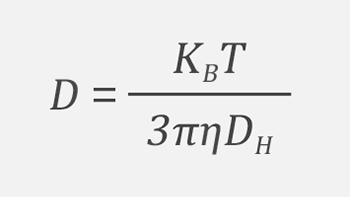
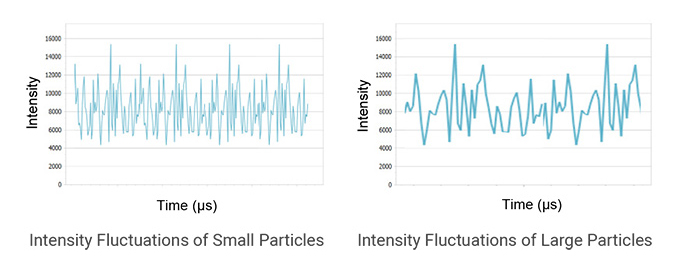
Dynamic light scattering (DLS), also referred to as photon correlation spectroscopy (PCS) or quasi-elastic light scattering (QELS), is a technique used to measure Brownian motion in a dispersant. It is based on the principle that smaller particles move faster while larger particles move slower. The scattering intensities of the particles are detected by an avalanche photodiode (APD) and then converted into a correlation function using a correlator. From this correlation function, a mathematic algorithm can be applied to obtain the diffusion coefficient (D). The hydrodynamic diameter (DH) and its distribution can be calculated using the Stokes-Einstein equation, which relates the diffusion coefficient to the particle size.
2. Backscattering Detection Technology
Features
- Wider Concentration Range
By optimizing the detection position, the highly concentrated samples can be detected near the edge of the sample cell, effectively minimizing the multiple light scattering effect.
- Higher Sensitivity
8-10 times scattering volume and around 10 times sensitivity as compared to the traditional 90° optical design.
- Higher Size Upper Limit
It mitigates multiple light scattering from large particles and, to some extent, reduces the number fluctuation of large particles due to the much larger scattering volume.
- Better Reproducibility
The DLS backscattering technology is less influenced by dust contaminants and unevenly distributed agglomerates and provides better reproducibility.
Intelligent Search for the Optimal Detection Position
- The software automatically determines the optimal detection position based on the size, concentration, and scattering ability of the sample to achieve the highest measurement accuracy and offer flexibility in detecting different types and concentrations of samples. This feature is particularly useful when dealing with a variety of samples, each with its unique scattering properties and concentrations.
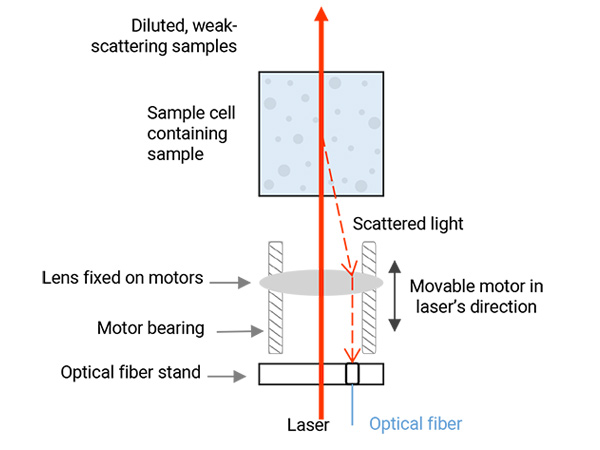
(1) The detection point in the middle of the sample cell
This leads to a large scattering volume that increases instrument sensitivity and is suitable for detecting dilute samples with weaker scattering effects.
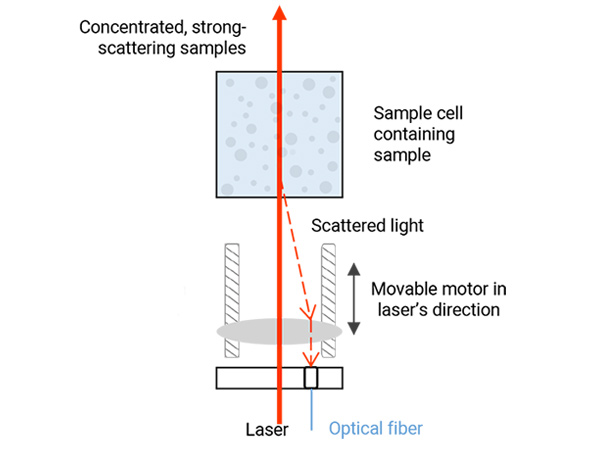
(2) The detection point at the edge of the sample cell
This avoids the multiple scattering effect of high concentration samples, ensuring accurate and repeatable particle size results.
3. DLS Flow Mode
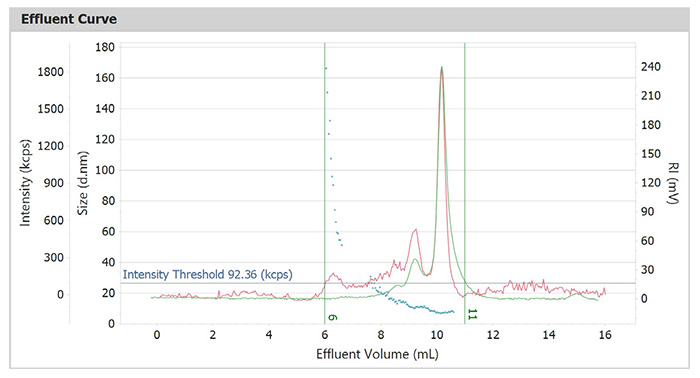
DLS flow mode provides a high-resolution size result of a complex, polydisperse system. When combined with front-end separation equipment such as GPC/SEC or FFF, particles are separated into monodisperse fractions and flow through the BeNano in sequence by size. The size of each fraction is continuously measured and summed into a high-resolution size distribution.
BeNano can acquire RI or UV signals, offering a more accurate volume and number distributions independent of algorithm compared to a batch-mode measurement.
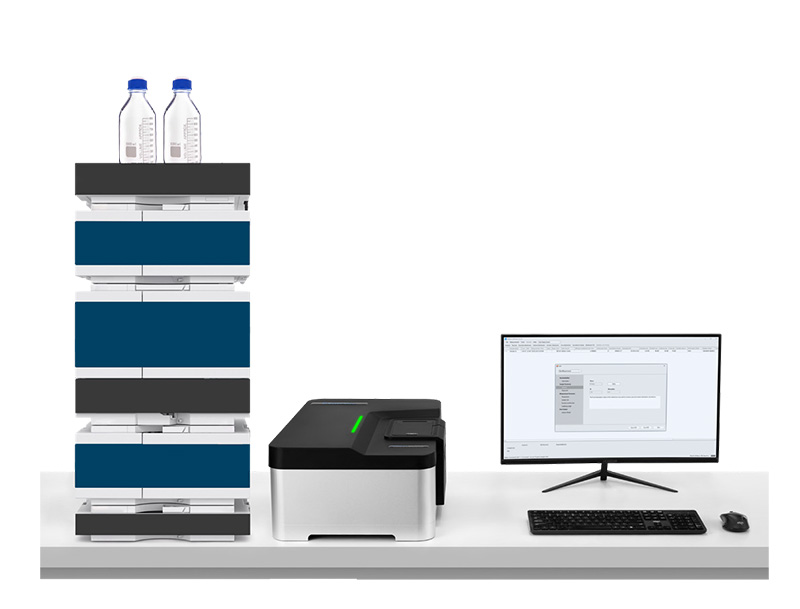
Integrated use of BeNano and SEC for particle characterization
Applications
- Characterizing particulates and polymers on size and dispersity
- Distinguishing monomers, dimers and aggregates of proteins
Effluent curves of size, intensity, and refractive index (RI)
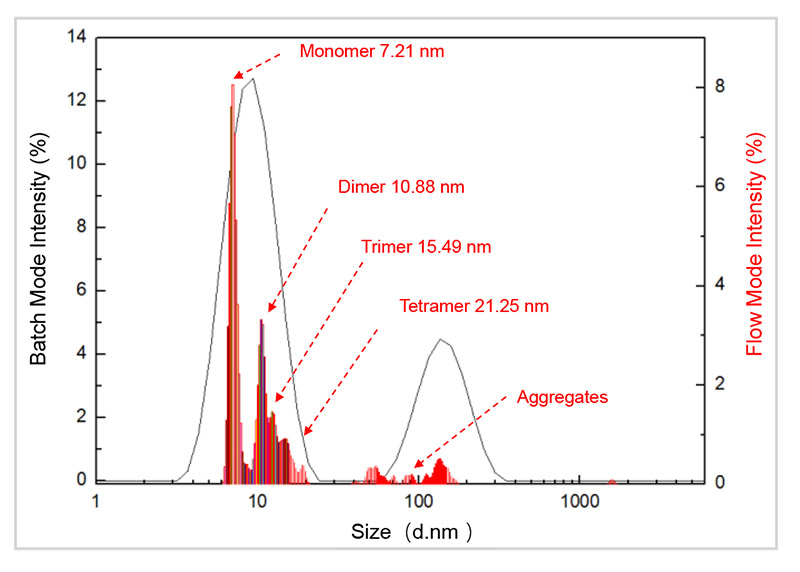 Black Curve : BSA size distribution with batch mode
Red Histograms : BSA size distribution with flow mode
Flow mode provides more precise information for characterizing BSA molecules on size and dispersity compared with batch mode.
4. High-resolution Size Measurement
Features
- DLS analyzer connecting with GPC/SEC, FFF, etc.
- Receiving up to 3 signals from RI, UV or other detectors
- 27uL low-volume flow cell to avoid band broadening
- Size resolution as high as 1.3 : 1
- Size distributions weighted by number and volume besides intensity
- Suitable for complex, polydisperse systems such as proteins, polymers, etc.
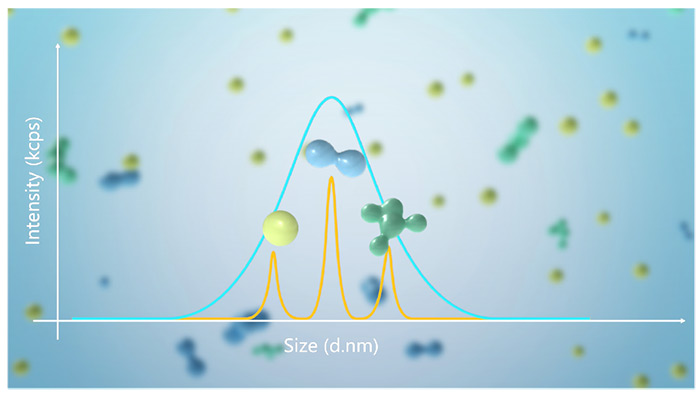
High-resolution size distribution achieved through flow mode
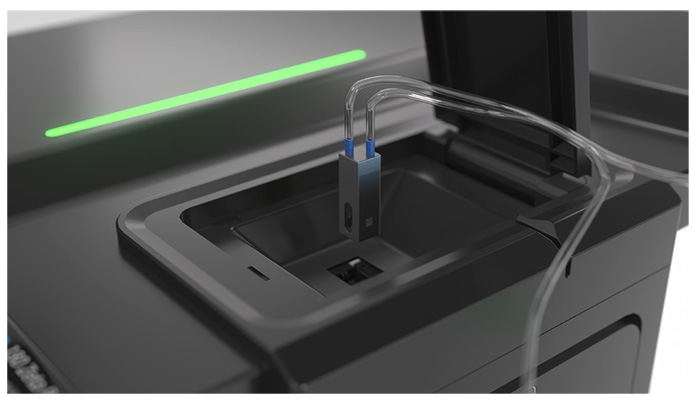
Particles remain in flow during measurement
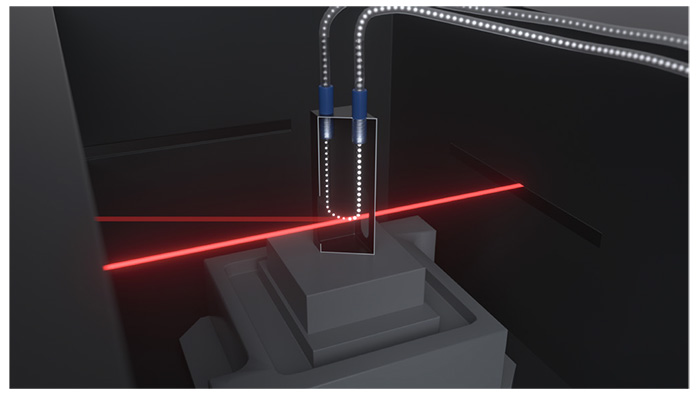
Following size separation, particles are detected
5. Zeta Potential Measured by Electrophoretic Light Scattering (ELS)
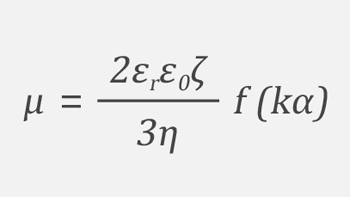
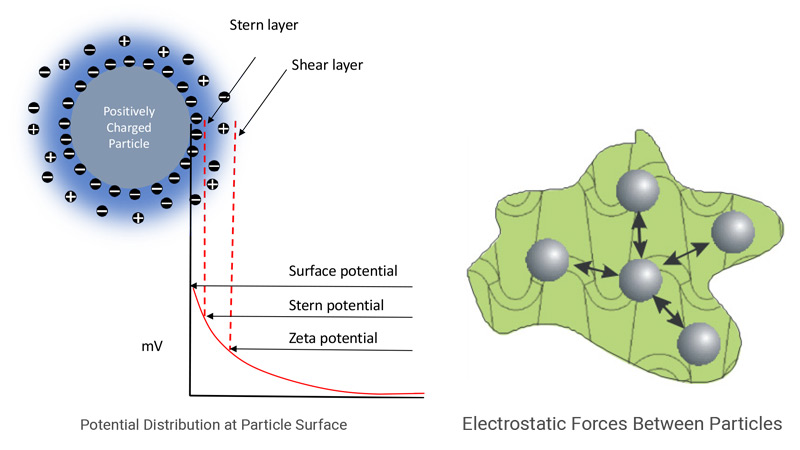
In aqueous systems, charged particles are surrounded by counterions that form an inner Stern layer and an outer shear layer. Zeta potential is the electrical potential at the interface of the shear layer. A higher zeta potential indicates greater stability and less aggregation of the suspension system. Electrophoretic light scattering (ELS) measures electrophoretic mobility via Doppler shifts of scattered light, which can be used to determine the zeta potential of a sample by Henry's equation.
6. Phase Analysis Light Scattering (PALS)
Phase analysis light scattering (PALS) is an advanced technology based on the traditional ELS technology, which has been further developed by Bettersize to measure the zeta potential and its distribution of a sample.
Features and Benefits
- Accurate measurement of samples with low electrophoretic mobility
- Effective for samples in organic solvents with low dielectric constant
- More accurate results for samples with high conductivity
- Effectively measures the zeta potential of particles whose charge approaches the isoelectric point

7. Static Light Scattering
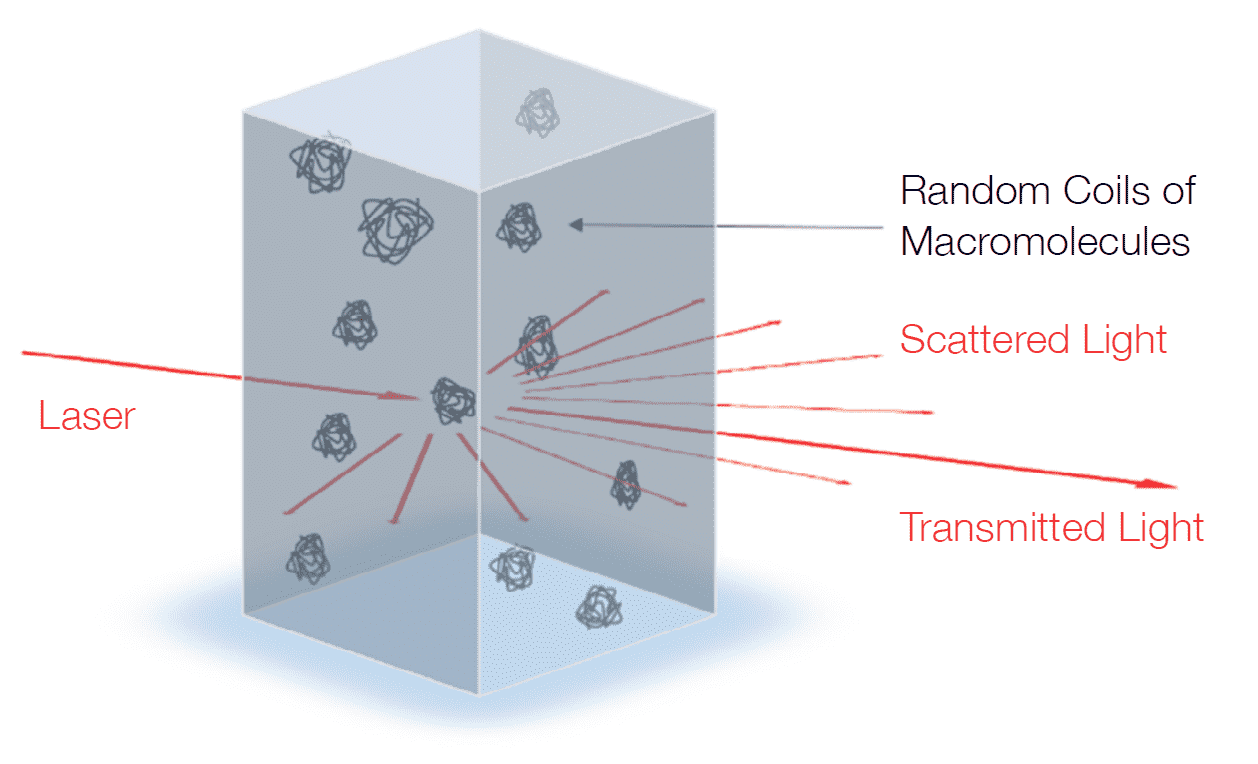
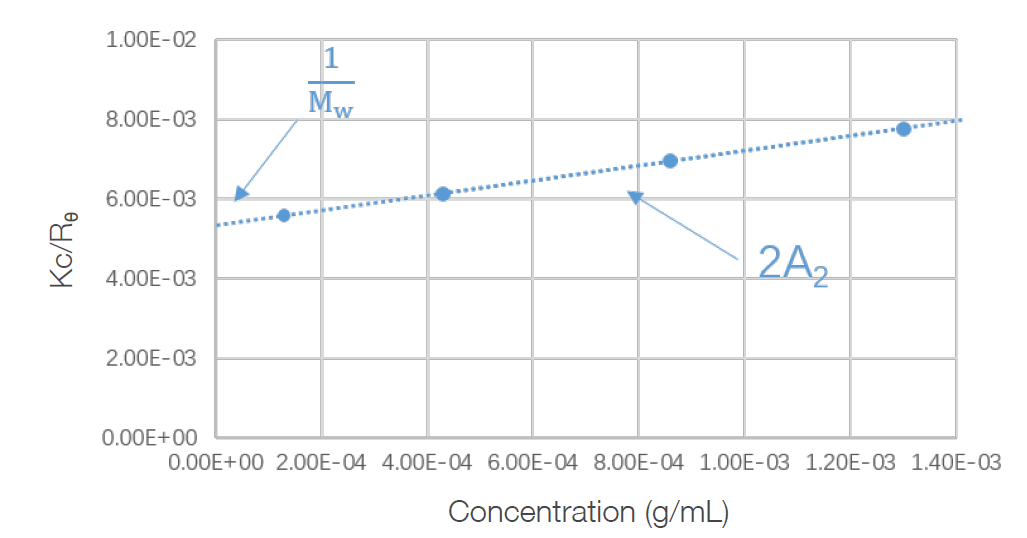
Static light scattering (SLS) is a technology that measures the scattering intensities, weight-average molecular weight (Mw), and second virial coefficient (A2) of the sample through the Rayleigh equation:

where c is the sample concentration, θ is the detection angle, Rθ is the Rayleigh ratio used to characterize the intensity ratio between the scattered light and the incident light at angle θ, Mw is the sample’s weight-average molecular weight, A2 is the second virial coefficient, and K is a constant related to (dn/dc)2.
During molecular weight measurements, scattering intensities of the sample at different concentrations are detected. By using the scattering intensity and Rayleigh ratio of a known standard (such as toluene), the Rayleigh ratios of samples at different concentrations are computed and plotted into a Debye plot. The molecular weight and the second virial coefficient are then obtained through the intercept and slope from the linear regression of the Debye plot.
8. Microrheology Measured by DLS
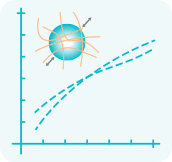
Dynamic Light Scattering Microrheology (DLS Microrheology) is an economical and efficient technique that utilizes dynamic light scattering to determine rheological properties. By analyzing the Brownian motion of colloidal tracer particles, information about the viscoelastic properties of the system, such as viscoelastic modulus, complex viscosity and creep compliance, can be obtained with the generalized Stokes-Einstein equation.

Features & Benefits
- Investigates rheological behaviors by measuring the thermally-driven motion of tracer particles within a material being studied
- Facilitates the measurement across a wide range of frequencies
- Applies low stress to tracer particles
- Requires only a microliter-scale sample volume
- Complements mechanical rheology results
- Suitable for weakly-structured samples
9. Temperature Trend Measurement
Measurement Parameters
- Size vs. Temperature
- Zeta Potential vs. Temperature
Features
- Benefit protein formulation stability study
- Accelerates real-time aging through elevated temperature simulation
Benefits
- Easy examination of protein formulation stability
- Accelerates real-time aging through elevated temperature simulation
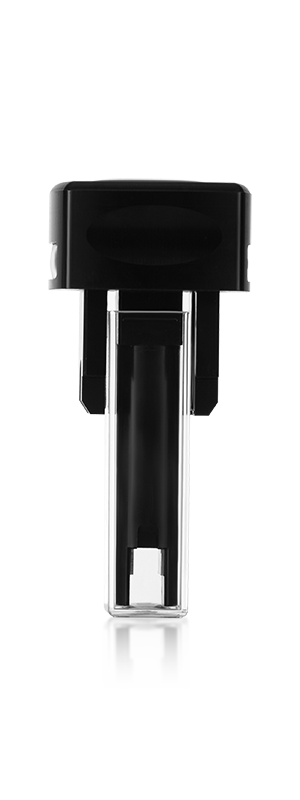
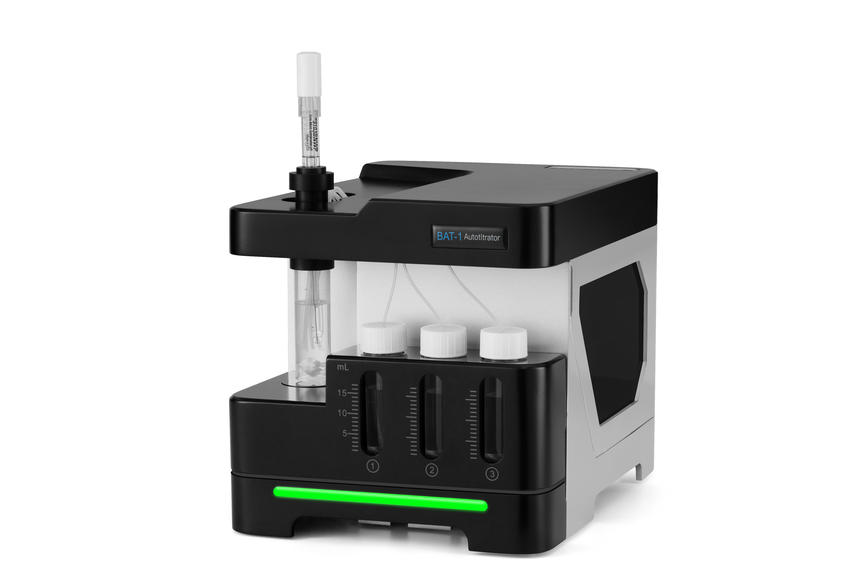
10. pH Trend Measurement
Measurement Parameters
- Zeta Potential vs. pH
- Isoelectric point
- Conductivity vs. pH
Features
- High-precision ternary titration pumps
- Controllable peristaltic pump with high flow capacity and high flow rate
- General-purpose electrode
- Automated titrant selection based on initial and target pH using intelligent software
Benefits
- Completes measurements within a shorter time
- Improves consistency and repeatability of results
- Reduces the workload of researchers
- Simplifies qualifications needed for operators
- Accelerates real-time aging through elevated temperature simulation
- Reduces exposure to corrosive liquids
Citations
- Bettersizer 2600
Functional redundancy as an indicator for evaluating functional diversity of macrobenthos under the mussel raft farm near Gouqi Island
DOI: 10.1016/j.aquaculture.2023.740024 Read ArticleZhejiang Ocean University | 2024Biological traits analysis (BTA) helps to evaluate the effects of different environmental variables on the traits-based functional composition of macrobenthos. However, research on functional traits of macrobenthos under mussel farming is limited. We investigated the spatial and temporal response of the benthic system in terms of taxonomic and functional diversity to environmental variables of farming and natural stressors resulting from suspended mussel farming near Gouqi Island of eastern China Sea. The functional traits of macrobenthic assemblages under mussel farming were characterized by “medium adult body size”, “vermiform body form”, “high flexibility”, “infauna”, “semi-motile”, “gonochoristic”, “surface deposit-feeders”, “carnivores”, “semi-motile burrowers”, and “tube-dwellers”. Functional redundancy was stable in response to mussel farming stresses among seasons, whereas species diversity showed efficient to evaluate natural variables. Functional diversity was significantly affected by farming stressors rather than natural variables, Further analysis using multivariate methods together with continuous monitoring were highlighted to evaluate the impacts of mussel farming. Our results reinforce the importance of macrobenthic species and functional traits analysis to evaluate human stresses driven impacts in offshore ecosystems. By analysing the environmental variables with different sources, independently, we concluded the main effects of human pressures on macrobenthic community. Such distinction could be particularly effective to isolate variable environmental descriptors and evaluate their effects on functional diversity, making the current approach promising for the evaluation of ecological effects of anthropogenic stressors in aquaculture areas. - Bettersizer 2600
Degradation characteristics and utilization strategies of a covalent bonded resin-based solid amine during capturing CO2 from flue gas
DOI: 10.1016/j.seppur.2023.125621 Read ArticleChina University of Petroleum | 2024In this study, various types of degradation as well as attrition which are possibly encountered in a circulating fluidized bed temperature swing adsorption (CFB-TSA) process, were conducted experimentally to evaluate the stability of a resin-based solid amine sorbent. Other characterizations methods, such as elemental analysis (EA), Fourier transform infrared spectroscopy (FTIR) etc. were applied to further reveal the degradation mechanisms. The results showed that thermal degradation occurs from 140–160 °C due to the decomposition of amine group. The CO2-induced degradation occurs from a higher temperature of 160–180 °C accompanied by the production of urea. Hydrothermal stability is good below 130 °C, but the ionic impurities in steam crystalized on particle surface can accelerate the degradation. Oxidative degradation is the most harmful, which starts at a lower temperature of 70–80 °C with the formation of aldehyde. The existence of H2O in atmosphere can alleviate the oxidative and CO2-induced degradations. The employed sorbent has a very low attrition index of 0.05, which is 1–2 orders lower than typical commercial fluidized bed catalysts. Based on the results of stability evaluation, some design suggestions for proper utilization of this sorbent or other similar resin-based sorbents have been provided in an industrial CFB-TSA process.
- Bettersizer 2600
De-branching of starch molecules enhanced the complexation with chitosan and its potential utilization for delivering hydrophobic compounds
DOI: 10.1016/j.foodhyd.2023.109498 Read ArticleShihezi University | 2024The current study aimed to prepare the complexes between debranched-waxy corn starch and chitosan polymers (DBS-CS), and then investigated their corresponding structural characteristics, rheological property and potent application in Pickering emulsion. The results indicated that the existence of chitosan significantly inhibited starch short-range molecular rearrangement for all DBS-CS samples, which was manipulated by both debranching treatment and chitosan content. Interestingly, this is the first study to reveal that the outstanding peak at 1.8 ppm in 1H NMR spectrum for sample DBS-CS was gradually shifted towards a lower-field region following an increased chitosan content. Moreover, the debranching treatment shifted the crystallinity pattern from A-type to B-type and the relative crystallinity of DBS-CS decreased gradually with the increased content of CS. All samples had a pseudoplastic fluid and shear-thinning behavior with an enhanced shear resistance following the complexation. The DBS-CS was applied in a Pickering emulsion for showing a greater emulsifying stability and a lower gel strength than native NS-CS prepared emulsion. Importantly, the encapsulation ability of curcumin in the DBS-CS emulsion was significantly improved, followed by an increase of 15.45% for its corresponding bioavailability compared to the control. Therefore, this study might highlight a potential carrier for delivering the bioactive substances in a green pattern. - Bettersizer 2600
Heat-induced aggregation behavior of wheat gluten after adding citrus pectin with different esterification degree
DOI: 10.1016/j.foodhyd.2023.109420 Read ArticleGansu Agricultural University | 2024Wheat gluten aggregation during heat treatment is beneficial to the final quality of gluten-based products. Exogenous pectin can affect gluten aggregation. However, the effect of pectin with different degrees of esterification on the heat-induced aggregation behavior of gluten and its possible mechanism are still unclear. Thus, the heat-induced aggregation behavior of gluten after adding pectin with different esterification degree was studied in this study. When the temperature was raised from 25 °C to 95 °C, pectin affected gluten aggregation and was related to the degree of esterification. Specifically, the results of rheological properties and particle size indicated that low-ester pectin improved the viscoelasticity of gluten and promoted gluten aggregation. Thermal properties revealed that enthalpy of gluten added with low-ester pectin (37%) increased from 92.96 J/g to 95.40 J/g during heating process. Structurally, the fluorescence intensity and surface hydrophobicity of gluten added with low-ester pectin (37%) were lower than those added with high-ester pectin (73%). In addition, low-ester pectin (37%) significantly increased the disulfide bond content (from 15.31 μmol/g to 18.06 μmol/g) and maintained β-sheet content of gluten compared with gluten alone at 95 °C, indicating that low-ester pectin was more likely to induce gluten aggregation. However, scanning electron microscope showed that the gluten added with low-ester pectin (46%) exhibited a denser network structure at 95 °C than that added with low-ester pectin (37%). These results will provide a theoretical base for the regulation of gluten aggregation and the quality of gluten-based products by pectin with different esterification degree.
- 1
- 2
- 3
- 4
- 5
- 6
- 84
Curated Resources
Testimonials


BeNano 180 Zeta Pro
The BeNano Series is the latest generation of nanoparticle size and zeta potential analyzers designed by Bettersize Instruments. Dynamic light scattering (DLS), electrophoretic light scattering (ELS), and static light scattering (SLS) are integrated into the system to provide accurate measurements of particle size, zeta potential, and molecular weight. The BeNano Series is widely applied in academic and manufacturing processes of various fields including but not limited to: chemical engineering, pharmaceuticals, food and beverage, inks and pigments, and life science, etc.
Related Particle Size Analyzer
-
Bettersizer S3 Plus
Particle Size and Shape Analyzer
Measurement range: 0.01 - 3,500μm (Laser System)
Measurement range: 2 - 3,500μm (Image System)
-
Bettersizer ST
One-stop Particle Size Analyzer
Dispersion type: Wet
Measurement range: 0.1 - 1,000µm
Repeatability: ≤1% variation
-
Bettersizer 2600
Laser Diffraction Particle Size Analyzer
Measurement range: 0.02 - 2,600μm (Wet dispersion)
Measurement range: 0.1 - 2,600μm (Dry dispersion)
Measurement range: 2 - 3,500μm (Dynamic imaging)
-
BeVision M1
Automated Static Image Analyzer
Dispersion type: Dry
Measurement range: 0.3 - 10,000 μm
Technology: Static Image Analysis
-
BeVision S1
Classical and Versatile Static Image Analyzer
Dispersion type: Dry & Wet
Measurement range: 0.3 - 4,500 µm
Technology: Static Image Analysis
-
BeScan Lab
Stability Analyzer
Particle size ranges from 10 nm to 1 mm
Volume fraction up to 95%
Compliance with ISO/TR 18811, 13097, 21357, 22107


