- ● What is image analysis?
- ● Why Image Analysis?
- ● How to Image Analysis?
- ● Literature and norms
- ● Related Products
What is image analysis?
The term “image analysis” is describing the mechanism: the image analyzer will capture an image of a 3-D particle first, then do the analysis based on the 2-D particle projection image. Depending on the movement state of particles during the measurement, the image analysis method is divided into 2 kinds: one is the dynamic image analysis method (DIA), and another is the static image analysis method (SIA).
Why Image Analysis?
Today, particle size alone may not be sufficient to get qualified products out the door. Many industries are turning to particle size and shape analysis. This is where the image analysis method comes in. The necessity for size and shape analysis of every single particle, combined with ever-increasing PC processing power, ensures that automated imaging methods are becoming increasingly more relevant to a market which is taking advantages of non-spherical particles.
Automated imaging methods for the determination of the particle size distribution of a material offers a fundamental advantage over alternative methods such as static light scattering, sedimentation or sieving: Each particle is photographed and thus analyzed individually! In addition, the individual photography of the particles gives the opportunity to make statistical calculations of not only the particle size but also the particle shape, this results in several important advantages for the determination of the particle size (shape) distribution:
- Realistic proportional values also at the edges of the size distribution, i. e. detection of oversized particles or fine particles
- More meaningful size and shape parameters of each single particle, instead of diameter of ideal spheres. e. g. geodetic length or elongation for fibers.
- For more information, please check the particle size and shape parameter guidebook
- Flexible changeovers between distribution types (volume / area / number) depending on the particular task
- Visual assessment of the dispersing state of a sample (dispersing quality, presence of agglomerates)
- Further differentiation of materials. For example, in addition to the particle size distribution, the roughness of the particle surface plays an important role for the success of shaping or polishing.
How to Image Analysis?
The determination of the particle size and shape by image analysis method includes 4 basic steps:
1. Image taking
The image taking process is the base of the image analysis method. Special digital cameras are ultilized to ensure a clear vision contains sharp images of particles. If necessary, the camera can be in combination to a microscope.
2. Image processing and particles detection
Appropriate software processes captured pictures: signal noise, isolated pixels and edging particles are eliminated, brightness is adjusted to strengthen the contrast between the particle and the background, etc.
Particles are then separated from the background. Depending on the application, special requirements will be employed to filter out part of particles, such as agglomerates, bubbles, or reflecting metal powders.
3. Particle size and shape calculation
Size and shape parameters of every single particle will be calculated with the software.
4. Statistical calculations and classification
The particles are arranged in classes (e.g. size equivalent classes) on the basis of their attributed features (size and shape parameters).

Processing chain
Literature and norms
/1/ ISO 13322-1: Particle size analysis – Image analysis methods – Part 1: Static image analysis methods
/2/ ISO 13322-2: Particle size analysis – Image analysis methods – Part 2: Dynamic image analysis methods
/3/ ISO 9276-6 Representation of results of particle size analysis – Part 6: Descriptive and quantitative representation of particle shape and morphology
Related Products

Bettersizer S3 Plus
Particle Size and Shape Analyzer
Measurement range: 0.01 - 3,500μm (Laser System)
Measurement range: 2 - 3,500μm (Image System)

BeVision D2
Dynamic Image Analyzer
Dispersion type: Dry
Measurement range: 30 - 10,000μm
Technology: Dynamic Image Analysis

BeVision M1
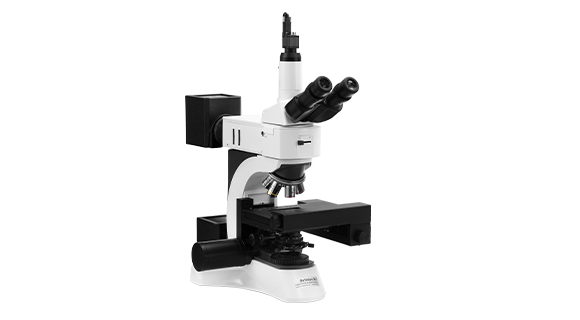
Automated Static Image Analyzer
Dispersion type: Dry
Measurement range: 0.3 - 10,000 μm
Technology: Static Image Analysis

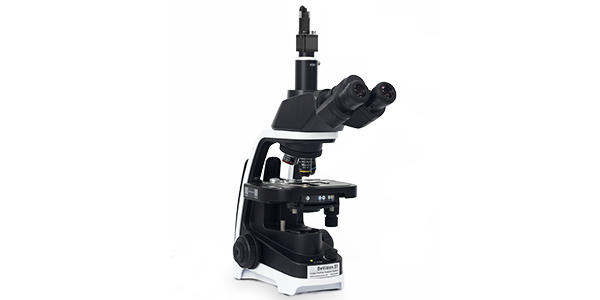
BeVision S1
Classical and Versatile Static Image Analyzer
Dispersion type: Dry & Wet
Measurement range: 0.3 - 4,500 µm
Technology: Static Image Analysis

