
Stability Analysis of Electrode Slurries based on Static Multiple Light Scattering
2025-03-07Application Note
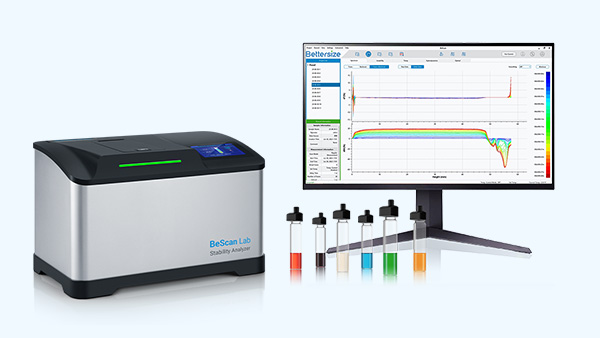
The stability of electrode slurry is affected by factors such as the composition and percentage of ingredients, the particle size and size distribution of the active material particles, the viscosity of the medium, and the mixing processes. An optimal formula can ensure the mechanical and conductive properties of the electrode slurry. In this measurement, two slurries were analyzed with the BeScan Lab for both qualitative and quantitative analysis. Additionally, the BeScan Lab can also be used to characterize the surface of the electrode sheets.
| Product | BeScan Lab |
| Industry | Battery and Energy |
| Sample | Electrode Slurries |
| Measurement Type | Stability |
| Measurement Technology | Static Multiple Light Scattering (SMLS) |
Jump to a section:
Introduction
The rapid growth of the new energy industry has increased the demand for high-performance batteries. Conventional batteries, such as lithium iron phosphate and ternary lithium batteries, are produced using electrode slurries, where the positive or negative active material is typically mixed with binders, additives, and solvents. Electrode slurries that are unstable may result in undesirable phenomena such as flocculation and sedimentation of active material particles, severely impacting the subsequent coating and calendering processes, as well as the overall battery performance. The stability of electrode slurry is affected by factors such as the composition and percentage of ingredients, the particle size and size distribution of the active material particles, the viscosity of the medium, and the mixing processes. An optimal formula can ensure the mechanical and conductive properties of the electrode slurry.
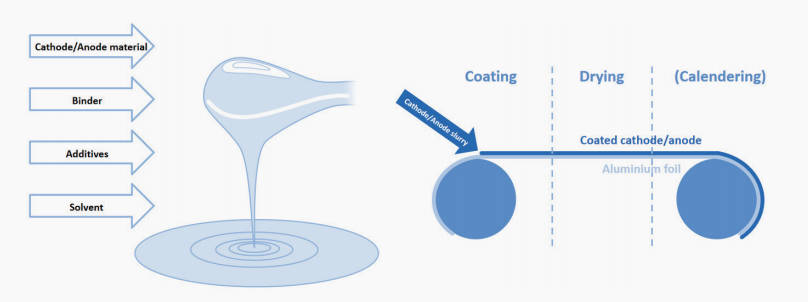
Figure 1. Manufacturing of electrode sheet.
Stability analysis with the BeScan Lab
BeScan Lab utilizes Static Multiple Light Scattering (SMLS) technique to detect subtle variations in the transmitted and backscattered signals along the vertical direction. It achieves this by scanning every 20μm along the sample height using an 850nm LED light source. Scans are repeated according to a customized SOP to characterize the stability of the system over time or temperature, qualitatively identifying unstable phenomena in slurries and quantifying the destabilization by calculating the instability index (IUS).
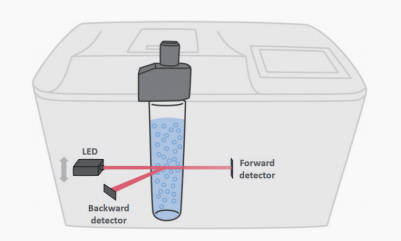
Figure 2. Measurement principle of the BeScan Lab.
Measurement procedure
Two highly viscous electrode slurries were measured with the BeScan Lab. A volume of 20mL of each slurry was transferred with a pipette to the sample cell, and scanned every 60 minutes at 30 ⁰C. The scan was repeated 90 times. Measuring electrode slurry is time-consuming due to its extremely high viscosity, which retards the movement of suspended substances. Consequently, detecting destabilization requires more time. However, the “one-to many” system of theBeScan Lab enables simultaneous measurement of multiple slurry samples using one computer interface. This “one-to-many” system saves valuable time and enhances measurement flexibility.
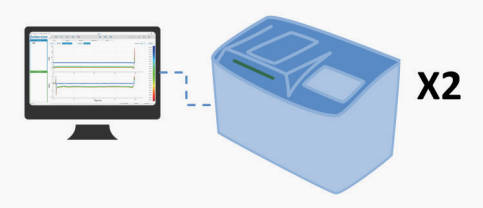
Figure 3. “One-to-many” system of the BeScan Lab.
Results and discussions
1. Backscattered signal
Due to the black appearance of the electrode slurries, transmitted signals are difficult to detect as light propagation is significantly hindered. Therefore, backscattered signals are used for stability analysis. The intensity of the backscattered signal is moderate because the electrode slurries have strong visible light absorption. Initially the sample is homogeneous, there is little variation in the light intensity as a function of height. To emphasize the change in backscattering over time, delta signals are presented, which is the change in light intensity at each vertical position as a function of the number of scans. The delta backscattered signals for both slurries are shown in Fig. 4.
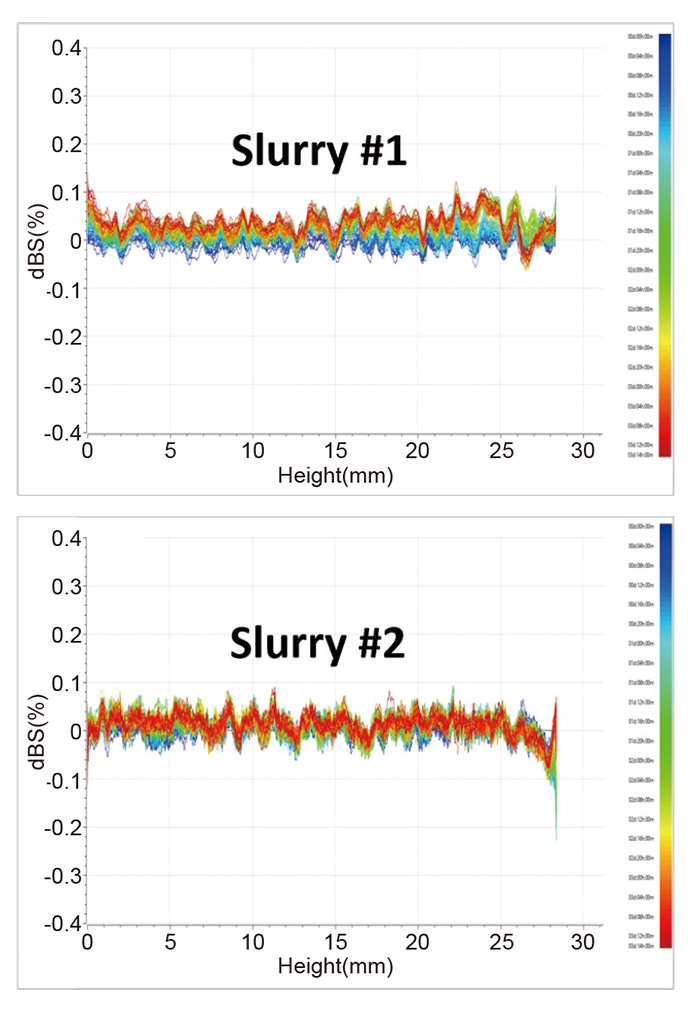
Figure 4. Delta backscattered signals of slurry #1 and #2.
Different scans are represented by different colors, with blue indicating the first scan and red indicating the last one. The first scan is used as a reference in the delta signal to track the evolution of unstable phenomena from the initial state.
The overall increase in the backscattered signal in the middle section of chart for slurry #1 suggests possible flocculation of the active materials. No significant variation in backscattered signal is observed in slurry #2.
2. Particle size
Particle size measurements for active materials of slurry #1 and #2 were carried out with the Bettersizer 2600 laser diffraction particle size analyzer to determine the relationship between particle size and stability. The results are shown below in Fig. 5.
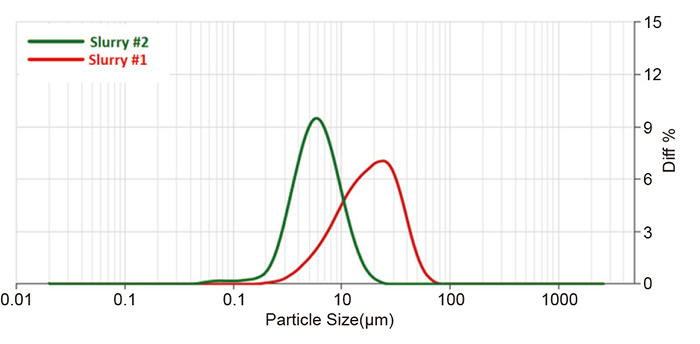
| Sample | Dx | Size(μm) |
| Slurry #1 | D10 | 6.939 |
| D50 | 17.97 | |
| D90 | 36.80 | |
| Slurry #2 | D10 | 3.068 |
| D50 | 5.798 | |
| D90 | 10.81 |
Figure 5. Particle sizing of slurry #1 and #2.
The particle size of the active material from slurry #2 is smaller than that of slurry #1. Additionally, the size distribution of the active material in slurry #2 is also narrower than that in slurry #1 as indicated by the ratio of D10/D90.
Small particles are preferred in slurry formulations because of the increased surface area and the reduced tendency to settle. Active material with a narrow particle size distribution is easier to mix thoroughly. If stirring is insufficient, large and small particles in a sample with a wide particle size distribution tend to separate from each other, leading to a heterogeneous system.
3. Uniformity
Uniformity is a parameter used to describe whether the suspended substances are evenly distributed in a sample, and is calculated using the standard deviation (SD) of the intensity of the backscattered signal within a specific range. The smaller the uniformity is, the more evenly the suspended substances are distributed. The calculation formula is given by:
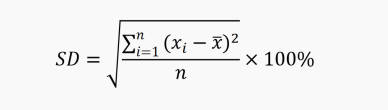
| Sample | Slurry #1 | Slurry #2 |
| Uniformity | 5.79 | 5.47 |
Table 1. Uniformity of the slurry #1 and #2.
Uniformity of slurry #2 is smaller than that of slurry #1, demonstrating better distribution uniformity of suspended substances in slurry #2. When binders and additives are evenly dispersed among the active materials, it reduces the possibility of particle flocculation and benefits the subsequent coating and calendering processes, ultimately enhancing the battery’s final performance.
Uniformity is affected by factors such as formulation, particle size distribution, and stirring process. An improper formula may lead to unbalanced proportion of components, causing unstable phenomena. For example, insufficient binders may cause flocculation and sedimentation of suspended particles, while coarse particles may settle, leading to structural defects such as cracking after coating. The power, duration, and extent of the stirring process also affect uniformity.
4. Instability index (IUS)
The calculation of the instability index (IUS) considers all variations between two consecutive scans. The greater the fluctuation in the signal intensity is, the greater the IUS will be, indicating a less stable system. Each individual scan generates an IUS. The changing curves of IUS over time for the two slurries are shown in Fig. 6 to facilitate comparison and predict their long-term stability.
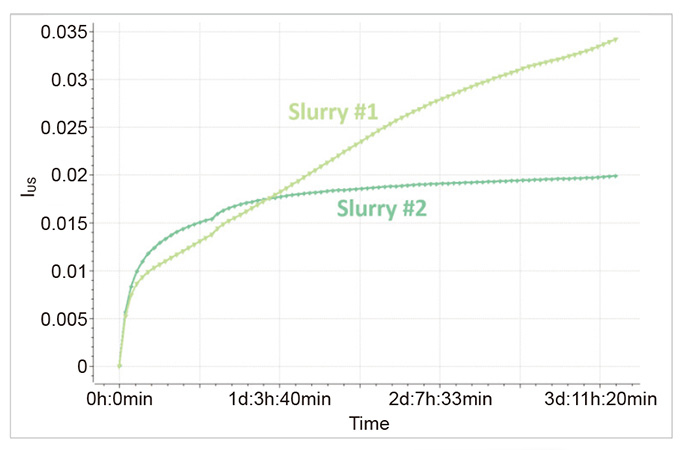 Figure 6. Changing curves of IUS over time of slurry #1 and #2.
Initially, the IUS of slurry #2 is greater than that of slurry #1. Subsequently, the IUS of slurry #1 exceeds that of slurry #2 and continues to increase, whereas the IUS of slurry #2 shows only a slight increase over time. Based on the trends in the changing curves, slurry #1 is likely to become unstable in the long term.
5. Surface characterization
A special application for electrode sheets can be performed using the BeScan Lab, where an electrode sheet is embedded into the sample cell and tightly attached to the inner wall of the sample cell. The electrode sheet is illuminated by an LED and backscattered signals related to the surface of the electrode sheet are recorded. The intensity of the backscattered signal is used to characterize the surface, evaluating the quality of the coating and calendering processes.
When the signals are smooth along the sample height, it indicates that the coating process ensures the electrode slurry is evenly spread on the metal foil. If obvious fluctuations in the signal are shown, surface quality is not optimal due to uneven coating of the electrode slurry, cracking problems on the electrode layer, or insufficient stirring of the electrode slurry.
Coring cells were used for surface characterization. Coring cells are suitable for highly viscous samples or foam, as they have an opening at the bottom that facilitates the addition of the samples that suffer from poor-quality meniscus. In this case, electrode sheets were rolled up and inserted into the coring cells from the bottom.
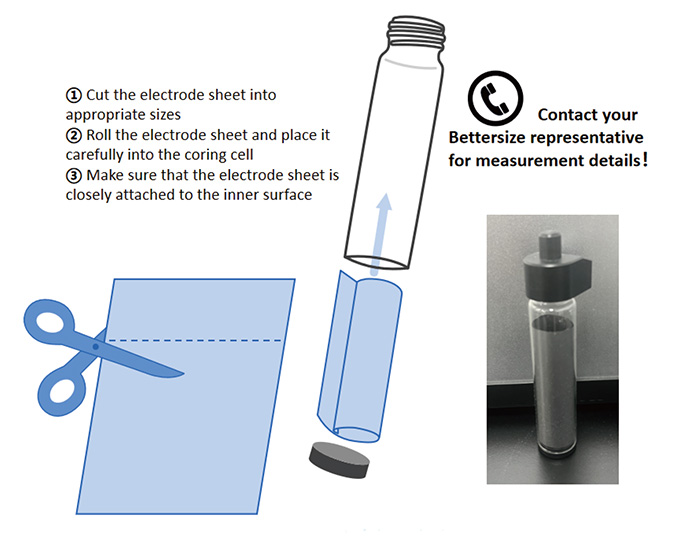
Figure 7. Measurement of electrode sheet.
During this measurement, the electrode sheets made from slurry #1 and slurry #2 were measured with the BeScan Lab. The scan was repeated three times. Backscattered signals were used for analysis and the measurement results are shown below.
Table 2. Uniformity of the electrode sheets made from slurry #1 and slurry #2.
| Sample | Uniformity | Average |
| Slurry #1 | 0.41 | 0.41 |
| 0.41 | ||
| 0.43 | ||
| Slurry #2 | 0.29 | 0.29 |
| 0.28 | ||
| 0.29 |
Uniformity is used to assess the flatness of the electrode sheet surface. A smaller uniformity value indicates a flatter surface. The uniformity of slurry #2 is smaller than that of slurry #1, although the difference is slight, suggesting a better quality electrode sheet made from slurry #2. Since no significant changes in the backscattered signal over time are observed, it can be inferred that no cracking and bulging issues are present on the surface.
Conclusion
In this measurement, two slurries were analyzed with the BeScan Lab for both qualitative and quantitative analysis. Unstable phenomena were observed in slurry #1 by analyzing delta backscattered signals. The quantitative analysis using the instability index (IUS) demonstrates that slurry #2 is more stable as the IUS of slurry #1 increases sharply after the initial stage. The results can be attributed to the small mean particle size, narrow particle size distribution, and small uniformity of slurry #2. Additionally, the BeScan Lab can also be used to characterize the surface of the electrode sheets. The quality of the electrode sheet made from slurry #2 is superior due to its smaller uniformity, demonstrating a flatter surface.
About the Author
 |
Paddy Zhou Application Engineer @ Bettersize Instruments |
|
BeScan Lab Stability Analyzer
|
 |
Rate this article