
Optimizing Pesticide Suspension Grinding Process with BeScan Lab and Bettersizer 2600
2025-03-11Application Note
This study employs the BeScan Lab stability analyzer and the Bettersizer 2600 particle size analyzer to quickly and accurately assess suspension stability and particle size, facilitating efficient product development and process optimization.
| Product | BeScan Lab , Bettersizer 2600 |
| Industry | Agrochemical Analysis |
| Sample | Pesticide Suspension |
| Measurement Type | Stability, Particle Size |
| Measurement Technology | Static Multiple Light Scattering (SMLS), Laser Diffraction |
Jump to a section:
Research Background
With the growing emphasis on environmental protection requirements, water-based, eco-friendly suspension concentrates (SC) have become increasingly popular in modern agriculture thanks to their environmental benefits, safety, efficiency, and cost-effectiveness. However, ensuring the stability of these suspensions remains a significant challenge, due to issues such as stratification, sedimentation, and particle aggregation. Grinding time, a crucial process parameter, directly influences particle size distribution and stability—short grinding times result in larger particles that are prone to sedimentation, while excessive grinding results in overly fine particles that compromise stability. Traditional stability testing methods, such as static observation and centrifugation, are slow, subjective, and lack real-time monitoring capabilities.
This study employs the BeScan Lab stability analyzer and the Bettersizer 2600 particle size analyzer to quickly and accurately assess suspension stability and particle size, facilitating efficient product development and process optimization.
Instrument Introduction
BeScan Lab
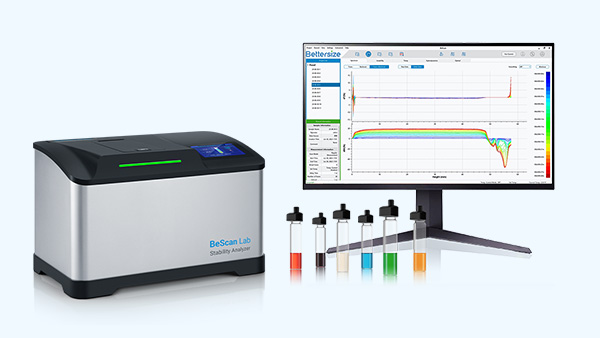
The BeScan Lab is a versatile stability analyzer based on Static Multiple Light Scattering (SMLS) technology, renowned for its high sensitivity and reliability. It is ideal for formulation development and quality control, capable of handling sample concentrations up to 95% v/v. This instrument supports various sample types, including emulsions, suspensions, and foams, and features temperature scanning up to 80 °C. BeScan Lab offers both qualitative and quantitative stability analysis, enabling users to evaluate and enhance long-term product stability and shelf life.
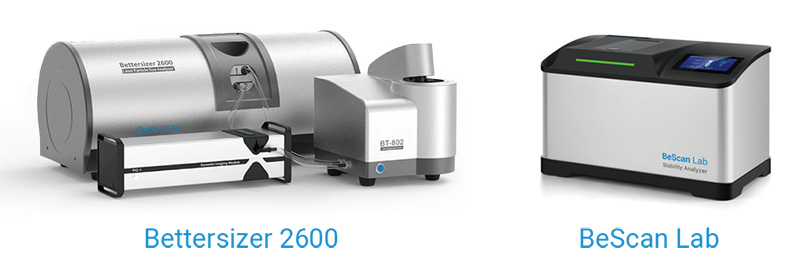
Bettersizer 2600
The Bettersizer 2600 is a cutting-edge particle size analyzer utilizing laser diffraction technology, offering a wide measurement range from 0.02 µm to 2600 µm. Its advanced optical system and analytical algorithms provide precise particle size analysis spanning from nanometers to millimeters, addressing a variety of testing requirements.
Experimental
- Sample Preparation
Pesticide suspensions with the same formula were prepared using varying grinding times: 10minutes, 30 minutes, 50 minutes, 70 minutes, and 90 minutes.
- Particle Size Distribution Measurement
The particle size distribution (D10, D50, D90) of each sample was measured using the Bettersizer 2600. Each sample was tested three times, and the average values were recorded.
- Stability Measurement
For stability testing, 2 mL of each shaken sample was added to a low-volume sample bottle. The BeScan Lab stability analyzer continuously monitored changes in transmitted and backscattered light signals in real-time at 30°C for 24 hours.
Experimental Results
Particle Size Distribution
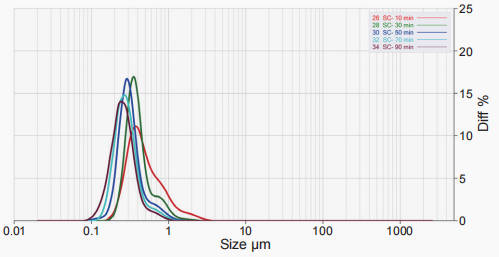
Figure 1. Particle size distribution of suspensions with varying grinding times
Table 1: Particle size test results of suspensions
|
Sample |
D10 |
D50 |
D90 |
|
SC- 10 min |
0.271 |
0.439 |
0.999 |
|
SC- 30 min |
0.266 |
0.370 |
0.703 |
|
SC- 50 min |
0.212 |
0.300 |
0.520 |
|
SC- 70 min |
0.187 |
0.273 |
0.447 |
|
SC- 90 min |
0.164 |
0.251 |
0.404 |
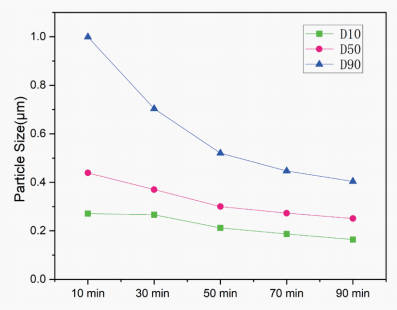
Figure 2. Particle size distribution of suspensions with varying grinding times
Analysis of the particle size distribution data (Figure 1-2, Table 1) indicates that as grinding time increases, D10, D50, and D90 values decrease. Specifically, D50 decreases from 0.439 µm to 0.251 µm, and D90 drops from 0.999 µm to 0.404 µm as grinding time increases from 10 to 90 minutes, indicating finer particles and a more uniform distribution.
However, after 50 minutes, the rate of particle size reduction slows, suggesting grinding efficiency is nearing saturation. A grinding time of 50 to 70 minutes is optimal, balancing particle uniformity and energy efficiency while avoiding excessive grinding, which may introduce stability risks. The next step is to use the BeScan Lab stability analyzer to assess the stability of suspensions ground for 30 to 90 minutes to identify the ideal grinding time.
Stability
- Destabilization Detection
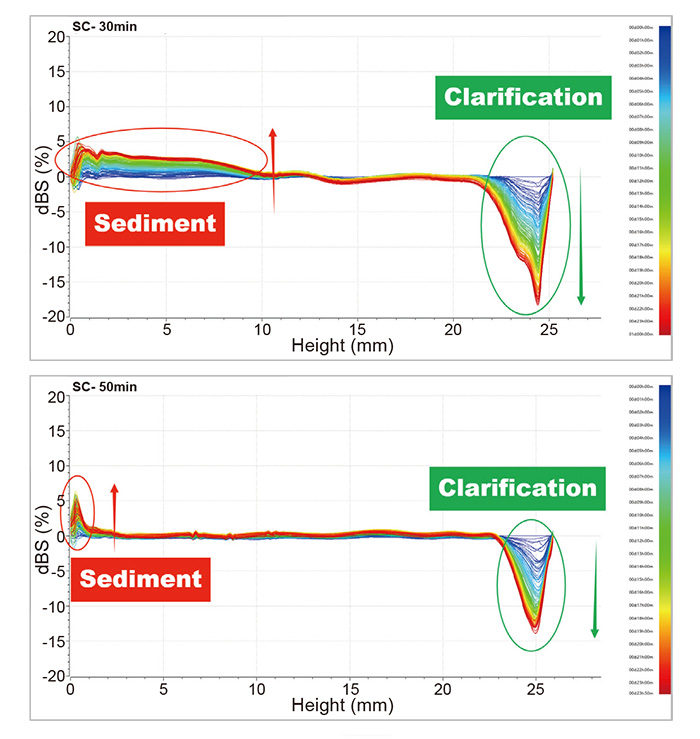
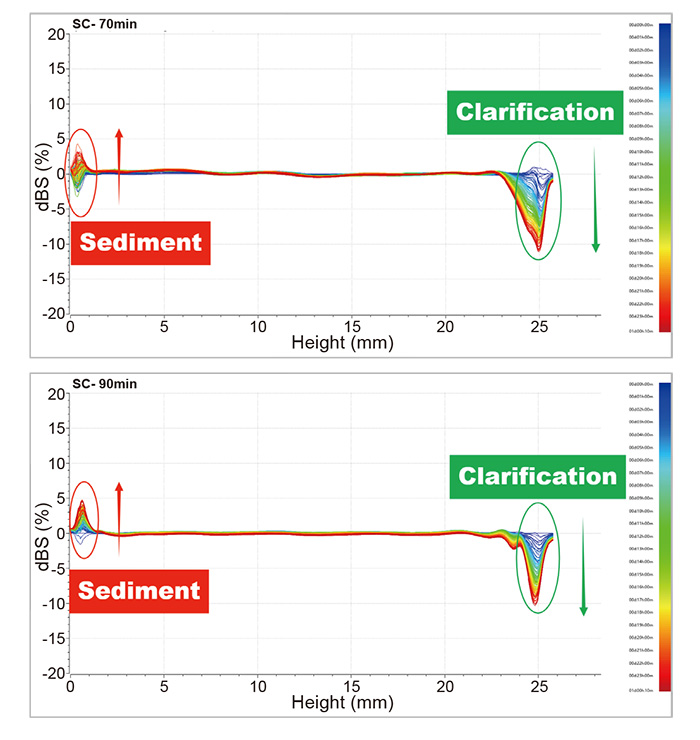
Figure 3. Delta Backscattered Signal (dBS) of Suspensions
The backscattered reference signal (dBS), shown in Figure 3, shows that all four suspensions exhibited varying levels of sedimentation and clarification. As grinding time increased, the sedimentation and clarification layers gradually diminished, with the most significant changes occurring between 30 and 50 minutes. Beyond 50 minutes, further grinding resulted in only minimal improvements. Although these changes were detectable with the BeScan Lab analyzer, they were not visually noticeable within one day (Figure 4), demonstrating BeScan Lab's superior sensitivity for early-stage stability detection and providing valuable data for process optimization.
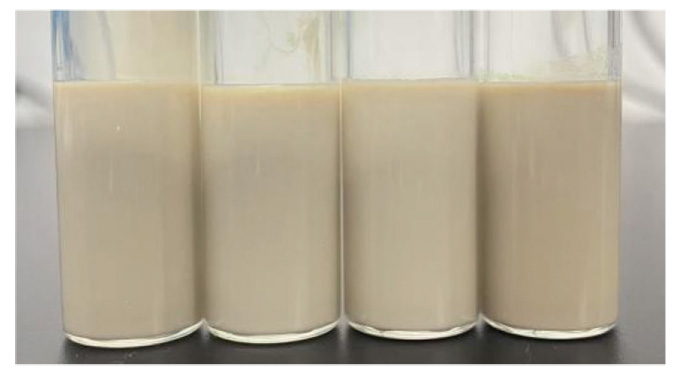
Figure 4. Difficulties in Observing Stratification and Sedimentation
- Quantitative Analysis of Instability and Stratification
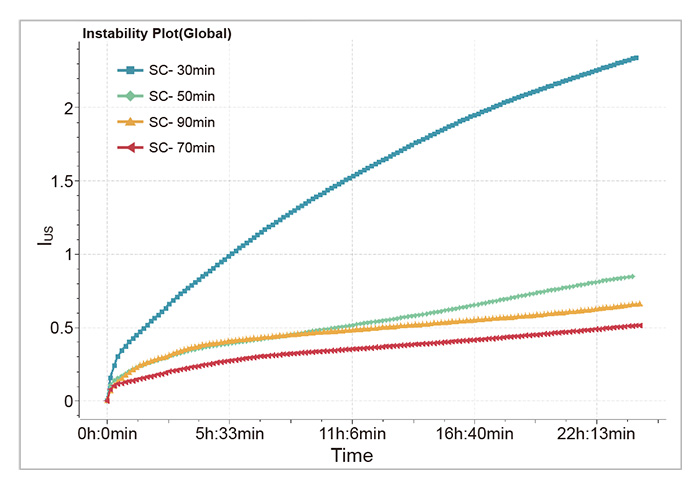
Figure 5. Instability Index (IUS) Kinetics
The original spectra clearly illustrate the destabilization process; however, quantifying stability differences in samples ground for 70 to 90 minutes proves challenging, as similar instability phenomena are observed in both the top and bottom layers. To achieve more precise quantification, the Instability Index (IUS) was used. The IUS consolidates all instability events over the testing period into a single index, with higher value indicating greater instability. As shown in Figure 5, the suspension ground for 70 minutes exhibited the lowest IUS value, indicating the best stability among all samples.
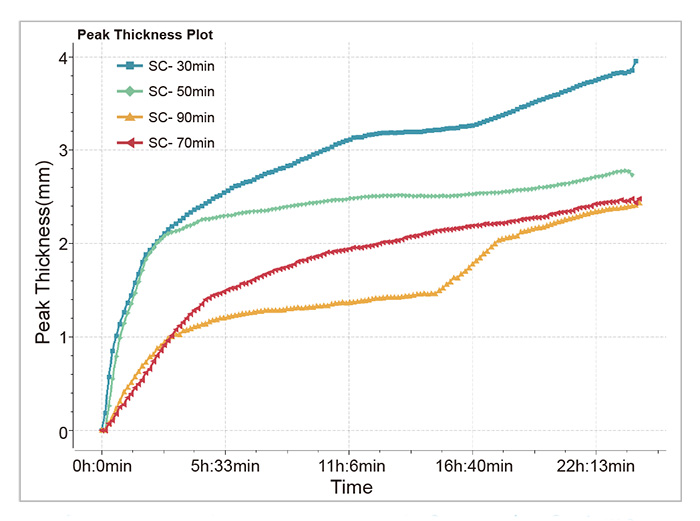
Figure 6. Kinetics of Stratification in Suspension Systems
Table 2. Stratification Thickness, Light Intensity Changes, and Sedimentation Rates for Suspensions
| Sample | Clarification Layer Thickness (mm) | BS Intensity Change in Clarification Layer (%) | Average Sedimentation Rate (mm/h) |
| SC- 30 min | 3.95 | -18.38 | 0.16 |
| SC- 50 min | 2.77 | -13.92 | 0.12 |
| SC- 70 min | 2.48 | -11.10 | 0.10 |
| SC- 90 min | 2.43 | -10.30 | 0.10 |
After prolonged settling, the concentration differences in the upper suspension become more pronounced, leading to greater clarification. To further investigate sedimentation rates and the extent of particle sedimentation, this study quantified the changes in the thickness and light intensity of the upper clarification layer. Larger clarification thickness and more significant light intensity changes indicate more severe stratification.
As shown in Figure 6, suspensions ground for 30 to 50 minutes exhibited a significant decrease in clarification thickness over time. In contrast, suspensions ground for 70 and 90 minutes showed similar clarification thickness and light intensity changes, indicating consistent sedimentation rates. This confirms that a grinding time of 70 minutes achieves the optimal balance between cost and stability, consistent with the IUS analysis, further validating the reliability of the 70-minute grinding process.
Comprehensive Analysis
The combination of the Bettersizer 2600 and the BeScan Lab allows for rapid particle size screening and precise formulation optimization within one day. This integration streamlines the transition from analysis to enhancement, providing robust technical support for both R&D and production processes.
Conclusion
The results show that grinding time significantly impacts the particle size distribution and stability of pesticide suspensions, with 70 minutes being the optimal duration. The synergy between the BeScan Lab and Bettersizer 2600 enables rapid, accurate, and non-destructive stability assessments, thereby streamlining R&D efforts. This method not only optimizes pesticide suspension processes but also addresses the limitations of traditional stability testing, promoting wider industrial application. Moreover, it is applicable to pharmaceuticals and cosmetics, supporting product quality and process optimization.
About the Author
 |
Xin Yan (Alia) Application Engineer @ Bettersize Instruments |
|
BeScan Lab Stability Analyzer
|
 |
Recommended articles
Rate this article