
Measuring the Sizes of Fluorescent Microspheres
2024-06-26Application Note
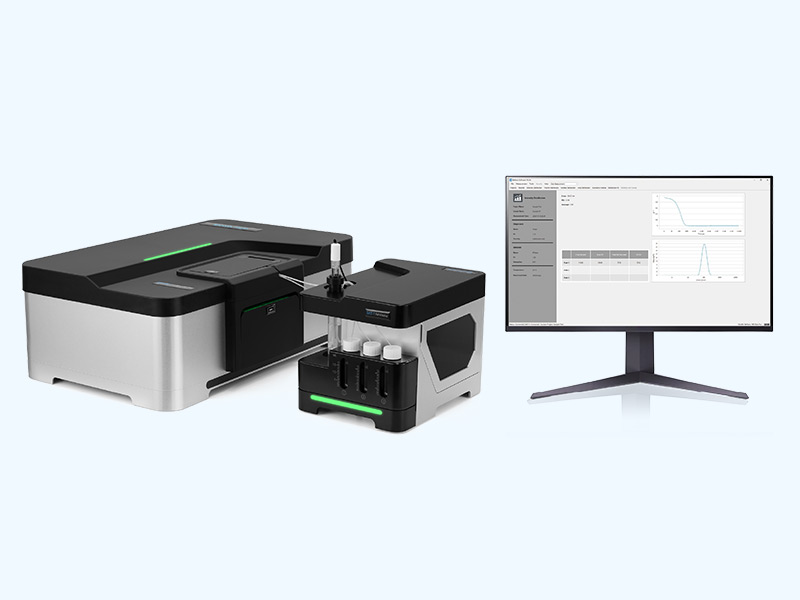
This application note showcases the BeNano 180 Zeta, which is equipped with a narrow band filter to accurately measure the particle sizes of fluorescent microspheres. The high correlation function intercepts and low PDI values reflect excellent signal-to-noise ratios and narrow distributions, suggesting minimal fluorescence interference and ensuring precise and consistent particle size measurements.
| Product | BeNano Series (BeNano 180 Zeta) |
| Industry | Biologics |
| Sample | Fluorescent Microspheres |
| Measurement Type | Particle Size |
| Measurement Technology | Dynamic light scattering (DLS) |
Jump to a section:
Introduction
Fluorescent microspheres can absorb specific wavelengths of light and emit distinct fluorescent spectra. They have broad applications in biomedical research, biosensors, fluorescent labeling, and cell imaging. These microspheres can serve as fluorescent probes, markers, or carriers for drug delivery, molecular diagnostics, cell tracking, and bioanalysis. Depending on the manufacturing process, materials, and microsphere size, fluorescent microsphere suspensions can display different colors.
Dynamic light scattering (DLS) is a widely used technique for determining the size of nanospheres, including fluorescent microspheres. However, the presence of fluorescence can sometimes interfere with DLS measurements.
Fluorescence typically exhibits a broad spectrum, which can cause increased fluctuations in the scattered light. This interference will reduce the test efficiency, as indicated by a lower intercept of correlation function, and lead to smaller apparent particle sizes and broader size distributions.
Despite this potential issue, not all the fluorescent microspheres will negatively impact DLS measurements. Most fluorescent microspheres have fluorescence absorption spectra that are lower than their emission spectra. By utilizing a red laser source in DLS equipment, most yellow and green fluorescent samples are not excited. This prevents these samples from emitting fluorescence during the measurement, thus avoiding interference and ensuring accurate size characterization.
For a few samples whose excitation band covers the wavelength of the DLS laser, a narrow band filter can be used in the optical path to filter out scattered light wavelengths other than the laser wavelength. This minimizes the impact of fluorescence on particle size measurements. In this application note, the BeNano 180 Zeta, equipped with a BT-NBF-671 cuvette containing a narrow band filter, was used to measure the particle size of different samples dispersed in an aqueous environment.
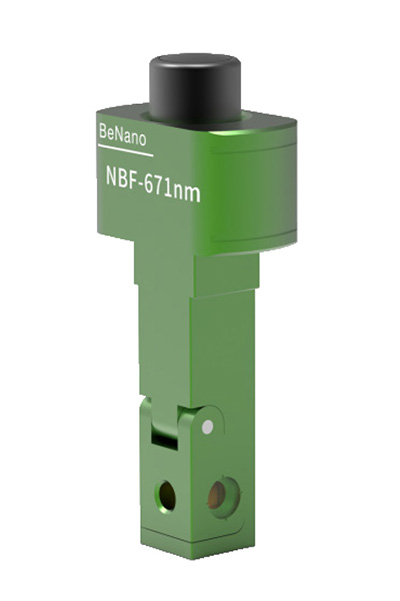
Figure 1. BT-NBF-671 Cuvette
Experimental
Five fluorescent microsphere samples were measured, with colors ranging from blue to red. The built-in temperature control system of the BeNano 180 Zeta was set to 25°C ± 0.1°C. Each sample was injected into the BT-NBF-671 cuvette with a narrow band filter, requiring only 16μL per sample. Particle size was measured at 173° by DLS. Each sample was tested at least three times to assess result repeatability and standard deviation.
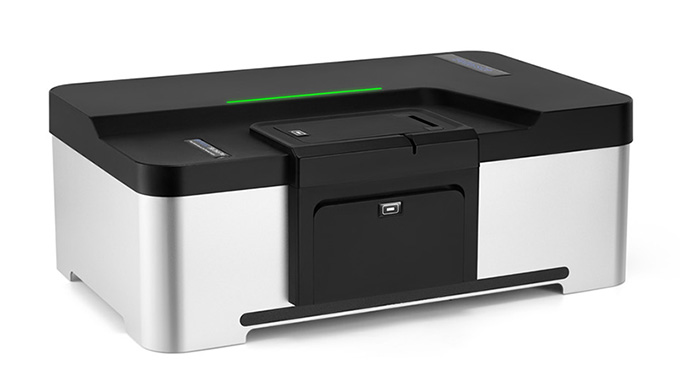
BeNano 180 Zeta Pro
Results and Discussion
Figure 2 shows the correlation functions of the five fluorescent microsphere samples. The high correlation function intercepts indicate good signal-to-noise ratios, demonstrating that the narrow band filter effectively suppresses the fluorescence effect. Figure 3 shows that all five samples exhibit a single peak and narrow distribution.
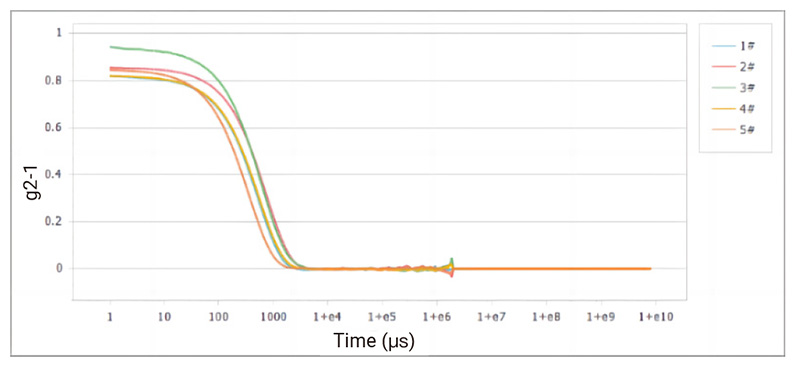
Figure 2. Correlation Curves of Samples 1-5
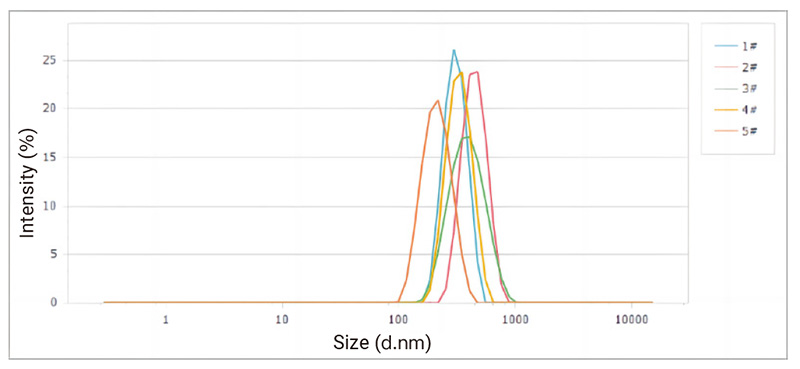
Figure 3. Particle Size Distribution of Samples 1-5
Table 1 lists the repeatability test results for the particle sizes of the five samples. The results show good repeatability, with average particle sizes (Z-ave) ranging from 200nm to 500nm and very small standard deviations. This indicates good dispersibility of the samples. The low PDI values suggest narrow distributions, further confirming that the fluorescence effect is effectively mitigated during the measurements.
|
Sample |
Size(d.nm) |
PDI |
|
1# |
325.83 ± 2.99 |
0.053 |
|
2# |
449.22 ± 8.02 |
0.040 |
|
3# |
375.38 ± 5.69 |
0.076 |
|
4# |
343.37 ± 0.17 |
0.030 |
|
5# |
216.18 ± 0.74 |
0.021 |
Table 1. Measured Size Results
Conclusion
The BeNano 180 Zeta, equipped with a narrow band filter, effectively measures the particle sizes of fluorescent microspheres. The high correlation function intercepts and low PDI values demonstrate good signal-to-noise ratios and narrow distributions, indicating that fluorescence interference is minimized, ensuring accurate and repeatable particle size measurements.
About the Authors
 |
Zhibin Guo Application Manager @ Bettersize Instruments |
 |
Dr. Ning Chief Product Officer @ Bettersize Instruments |
|
BeNano 180 Zeta Pro Nanoparticle Size and Zeta Potential Analyzer
|
 |
Recommended articles
Rate this article