
Investigating the Stability of Ibuprofen using BeScan Lab
2024-07-23Application Note
The stability of various commercial ibuprofen samples varies significantly, which is affected by many factors, such as particle size, particle size distribution, zeta potential, pH value, temperature, and viscosity. Analysis using BeScan Lab is a comprehensive solution to stability evaluation. In this measurement, sample 1 with small particle size, narrow particle size distribution, moderate zeta potential, and proper viscosity shows the highest stability.
| Product | BeScan Lab |
| Industry | Pharmaceuticals |
| Sample | Ibuprofen suspension |
| Measurement Type | Stability |
| Measurement Technology | Static Multiple Light Scattering (SMLS) |
Jump to a section:
Introduction
Ibuprofen suspension is a widely recognized pain reliever whose active pharmaceutical ingredients are evenly dispersed in the system. Suspension is a thermodynamically unstable system because of its high surface energy, but also a kinetic stable system due to the optimization of the formulation. As time goes on, flocculation, sedimentation, or phase separation may occur in the suspension, which leads to drug deterioration. To ensure the homogenization of the active ingredients, it is recommended to shake the ibuprofen suspension before dosing. Good stability after redispersion is a key to the high effectiveness of ibuprofen, demonstrating even distribution of active ingredients with external force after long-term storage.
Of primary importance is stability analysis after redispersion using BeScan Lab based on static multiple light scattering (SMLS) technology, which enables capturing of subtle variations of transmitted and backscattered signals that help you to identify and quantify the unstable phenomena.
Measurement
Three commercial ibuprofen samples were measured. Before measurement, ibuprofen samples were manually shaken 20 times with proper strength. Then 15 mL of each sample was introduced into the sample cell. The measurements were carried out with BeScan Lab under 30 ⁰C. The sample was initially scanned every minute for 1 hour, followed by a scan every 10 minutes for an additional 5 hours. Particle size measurement was simultaneously carried out with Bettersizer 2600 after shaking. For zeta potential analysis, samples were diluted 10 times with water and measured with BeNano 180 Zeta Pro three times to obtain the average result. Viscosity measurement was implemented with a commercial viscosity tester at 20 ⁰C.
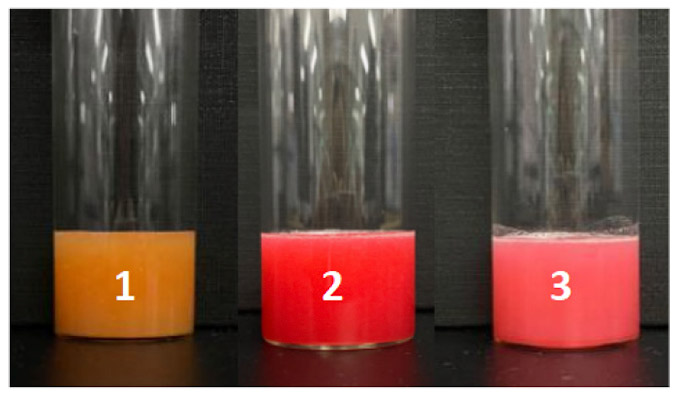
Before analysis
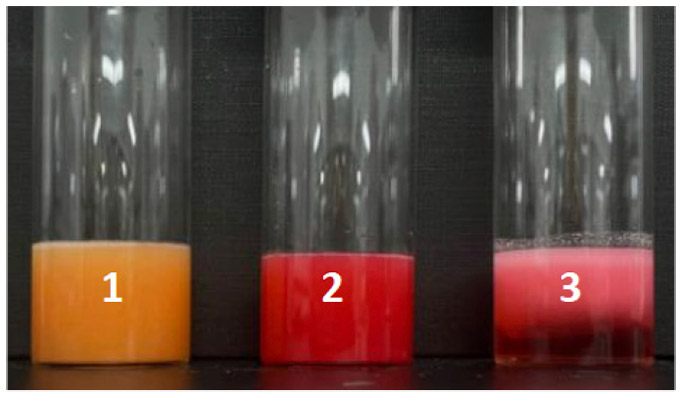
After 20 hours
Figure 1: Sample status before and after measurement.
Results
The measurement results for zeta potential, particle size, and viscosity are shown below in Table 1. Ionic stabilizers are commonly applied in suspensions, which affects the zeta potentials of the samples. If the absolute value of the zeta potential is larger than 30, it can be considered that the suspension is stable from the perspective of electric potential. The zeta potential of sample 3 is the largest and its absolute value is close to 30. The particle size result shows that sample 1 has the smallest particle size and the narrowest particle size distribution. Small particle size is associated with good stability because it reduces the possibilities of particle collision and subsequent aggregation.
Samples with wide particle size distribution are more likely to cause a concentration gradient that can lead to Ostwald ripening. High viscosity can slow down sedimentation. While low viscosity is beneficial to homogenization but accelerates sedimentation. Sample 2 has the highest viscosity and sample 3 has the lowest one.
Delta backscattered signal (dBS) is used for stability analysis. The spectra indicate that sample 1 is the most stable suspension because only creaming is clearly recognizable at the top. The decrease of the backscattered signal at the top of sample 2 demonstrates the sedimentation of suspended substances, and continuous sedimentation causes an overall increase in the backscattered signal in the middle part. Sample 3 is considered the most unstable system whose backscattered signal decreases at the top and increases in the middle, leading to a typical sign of phase separation. The floating up of small solids causes the backscattered signal to increase at the bottom.
Table 1: Measurement results of zeta potential, particle size, and viscosity.
| Sample | Zeta potential (mV) | Particle size (µm) | Viscosity (mPa·s) |
| 1 | -14.62 | D10=19.38, D50=38.57, D90=57.74 | 55.3 |
| 2 | -6.03 | D10=21.56, D50=51.11, D90=118.90 | 223.0 |
| 3 | -26.39 | D10=12.74, D50=67.96, D90=228.20 | 16.8 |
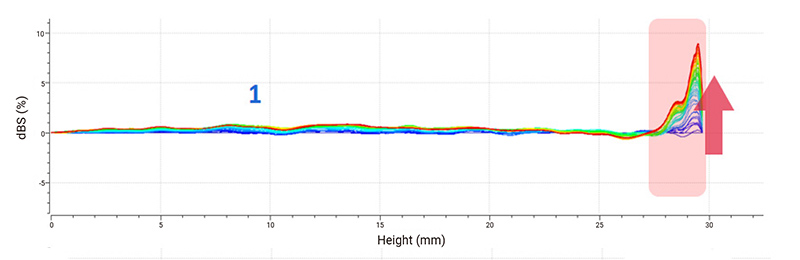
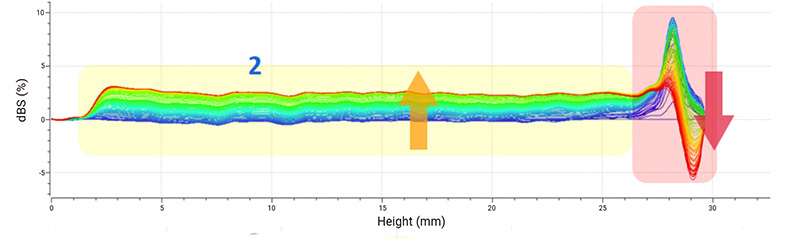
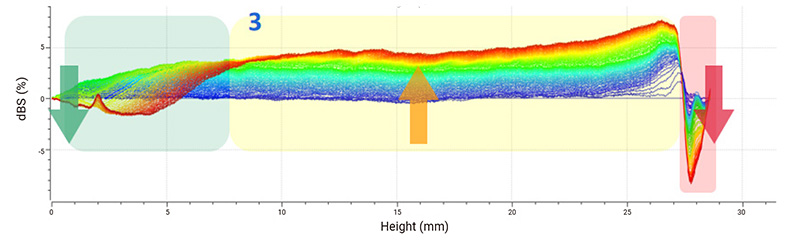
Figure 2: Delta backscattered signals (dBS) of ibuprofen samples.
The scatter plot based on optical analysis is shown in Fig. 3 to demonstrate how the middle part’s backscattered signals of the samples change over time. The variation of the backscattered signal of sample 1 is the smallest. While the backscattered signal of sample 3 changes intensely, which corresponds to the degree of particle size variation. The flocculation of suspended substances in sample 3 is the most obvious.
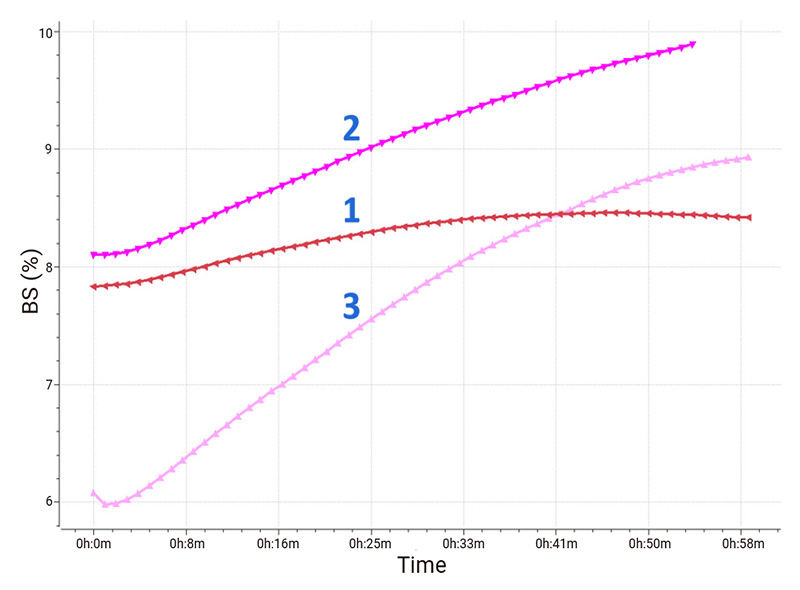
Figure 3: Variations of backscattered signals in the middle part.
Calculation of instability index (IUS) is a method to quantify destabilization. Based on the curves shown below in Fig. 4, sample 1 exhibits the highest stability due to its smallest instability index throughout the measurement period. The instability index of sample 3 grows faster than those of sample 1 and sample 2, showing that sample 3 is the most unstable.
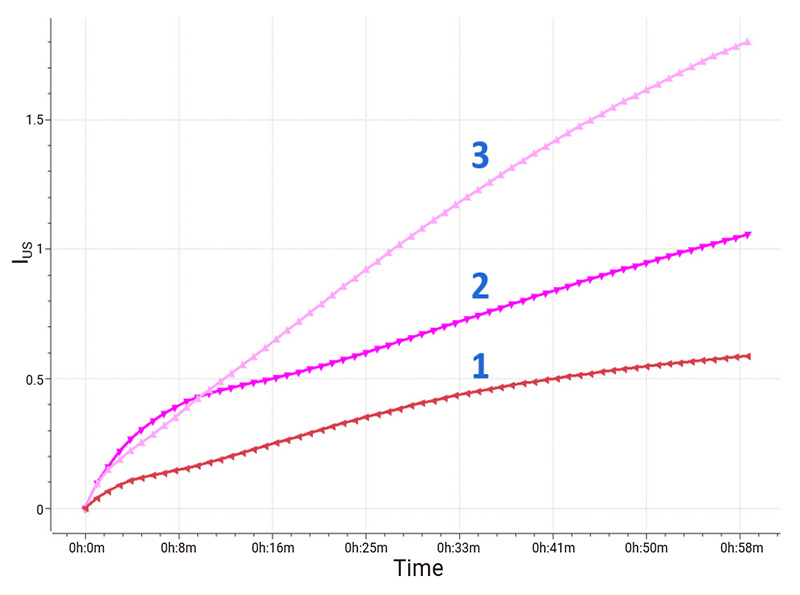
Figure 4: Change curve of instability index (IUS).
Each sample has a predominant property that contributes to good stability. Although sample 3 exhibits the largest zeta potential and the viscosity of sample 2 is the highest, sample 1, which has the smallest particle size, the narrowest particle size distribution, moderate zeta potential, and proper viscosity, is the most stable. Evaluation of stability relying only on one parameter is risky. Quantification of destabilization using the instability index is a more comprehensive solution.
Conclusion
The stability of various commercial ibuprofen samples varies significantly, which is affected by many factors, such as particle size, particle size distribution, zeta potential, pH value, temperature, and viscosity. Analysis using BeScan Lab is a comprehensive solution to stability evaluation. In this measurement, sample 1 with small particle size, narrow particle size distribution, moderate zeta potential, and proper viscosity shows the highest stability.
About the Authors
 |
Wenjian Zhou Application Engineer @ Bettersize Instruments |
 |
Xin Yan Application Engineer @ Bettersize Instruments |
|
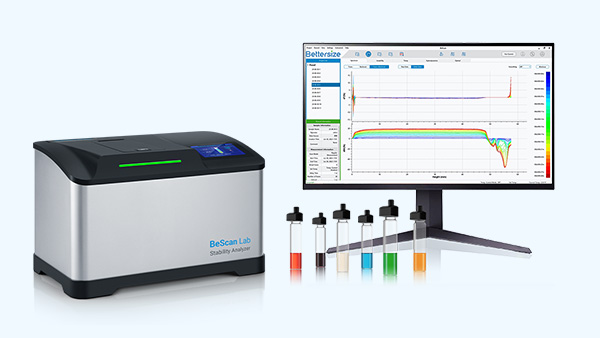
BeScan Lab Stability Analyzer
|
 |
Recommended articles
Rate this article