
Investigating the Effect of Dispersing Agent on the Stability of Suspension Based on SMLS Technology
2024-07-26Application Note
In this study, various dispersing agents were added to the suspensions of titanium dioxide nanoparticles for stability analysis, among which TWEEN® 80 improves the stability of suspension to the greatest extent. The study also shows that the optimal concentration of TWEEN® 80 is 1.0 wt%, based on the known results.
| Product | BeScan Lab |
| Industry | Nanomaterials |
| Sample | Titanium dioxide nanoparticle suspension |
| Measurement Type | Stability |
| Measurement Technology | Static Multiple Light Scattering (SMLS) |
Jump to a section:
Introduction
Suspension of titanium dioxide nanoparticles is widely used in manufacturing ceramics, daily chemicals, pigments, and optics. In most cases, nanoparticle suspensions are unstable due to the high specific surface area and surface energy of nanoparticles which leads to strong likelihood of particle agglomeration and subsequent sedimentation. Dispersing agents provide a viable solution to poor stability by adjusting electrostatic potential or modifying steric hindrance. Suspensions with high stability are beneficial to their final performance because good dispersibility of nanoparticles greatly improves effectiveness during application.
Based on SMLS technology, BeScan Lab enables sensitive detection of subtle variations of transmitted and backscattered signals that characterize destabilization. Screening of dispersing agents and dosage can be easily implemented using BeScan Lab by identifying and quantifying unstable phenomena.
Measurement
In this study, 5 nanoparticle suspensions (each 20.0 mL, containing 0.5 wt% of titanium dioxide and 0.5 wt% of dispersing agent) were prepared and measured with BeScan Lab to investigate the effect of different dispersing agents on the stability of nanoparticle suspension. Each sample was scanned every minute for 1 hour at 25.0 ⁰C. Besides stability analysis, the mean particle size of sample 1 and the zeta potential of all samples following a 100-fold dilution were measured with BeNano 180 Zeta Pro. The dispersing agents that were used are listed below in Table 1.
| Sample | 1 | 2 | 3 | 4 | 5 |
| Dispersing agent | - | SDS | TSPP | TWEEN® 80 | Span® 80 |
Table 1: Dispersing agents used in nanoparticle suspensions.
Result and Discussion
The mean particle size of titanium dioxide nanoparticles is 136 nm. The titanium dioxide nanoparticles are negatively charged with a zeta potential of -18.43 mV. The absolute value of the zeta potential increased after adding a dispersing agent. The zeta potential of sample 2 with SDS is -32.23 mV, indicating the highest stability among the five samples from the perspective of electric potential. The measurement results are listed below in Table 2.
| Sample | 1 | 2 | 3 | 4 | 5 |
| Zeta potential(mV) | -18.43 | -32.23 | -28.22 | -25.71 | -20.21 |
Table 2: Measurement result of zeta potential.
The transmitted signals were not obvious. Hence the delta backscattered signals (dBS) were applied for stability analysis, which are shown below in Fig. 1. Phase separation was observed in sample 5. The reason is that the suspension and the Span® 80 are incompatible. Therefore, sample 5 was excluded in the following stability analysis. The rest 4 samples exhibited sedimentation and the delta backscattered signals at the bottom of the rest 4 samples increased to varying extents. Simultaneously, the upper part became clear because suspended particles moved downwards.
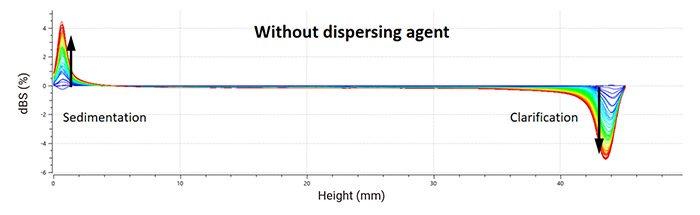
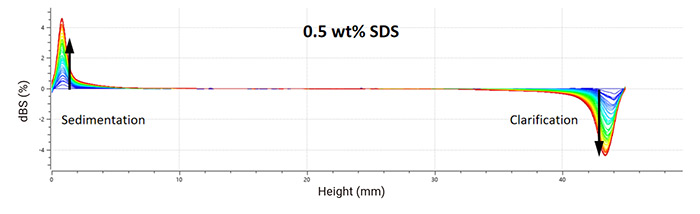
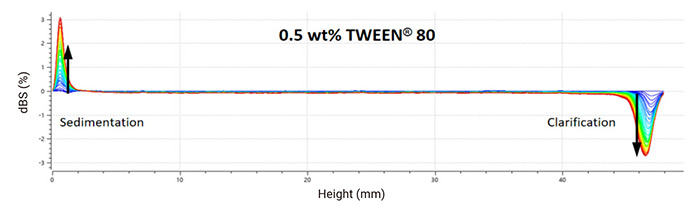
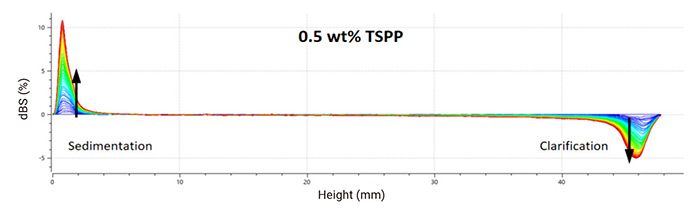
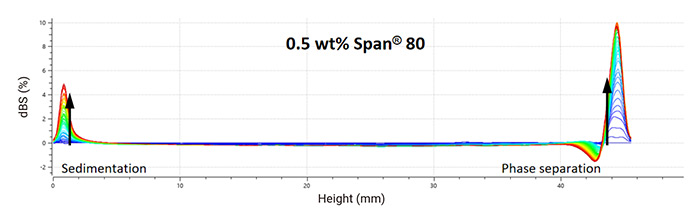
Figure 1: Delta backscattered signals (dBS) of the samples.
Fig. 2 shows the changes in the thickness of the sedimentation layer in different samples over time. The sedimentation layer first appeared in sample 3, followed by those in sample 1, sample 2, and sample 4. The layer thickness of sample 3 is the largest, reaching around 1.6 mm. The deviation of sample 2 from sample 1 is quite small, which demonstrates that the SDS did not slow down the sedimentation. In the presence of TSSP, sedimentation was accelerated in sample 3. The reason probably is that TSSP provides anions after dissolving in water, leading to the compression of diffuse layer and the weakening of electrostatic repulsive force between nanoparticles. Hence, attractive force dominated, and the nanoparticles aggregated and settled. SDS belongs to anionic dispersing agent as well. However, its large hydrocarbon tail contributes to steric hindrance, avoiding the above-mentioned adverse effect.
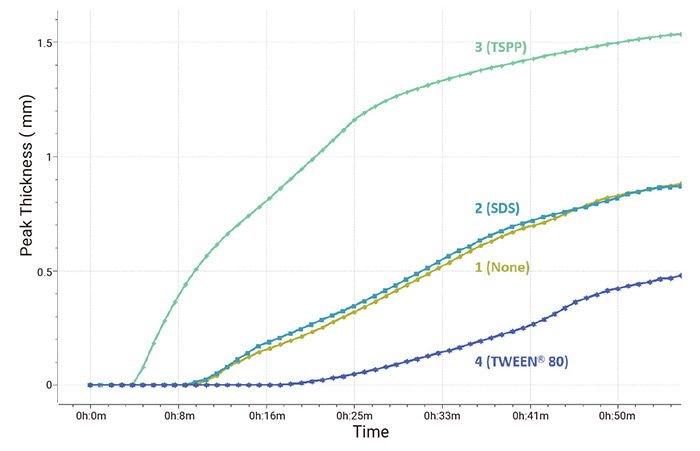
Figure 2: Changes in thickness of sedimentation layer for different samples.
By analyzing the changes in the thickness of the upper clear layer, the particle migration rates of different samples were obtained. Fig. 3 demonstrates that the presence of SDS and TWEEN® 80 can slow the particle migration rate. Sample 4 exhibits the lowest particle migration rate, which is 1.35 mm/h. Besides, particle migration in sample 4 started at 10 minutes, while those of the other samples began around 5 minutes after the beginning of the measurement.
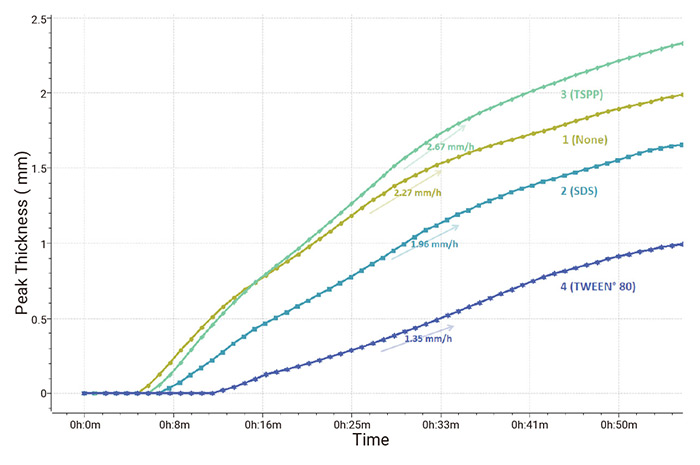
Figure 3: Particle migration rates for different samples.
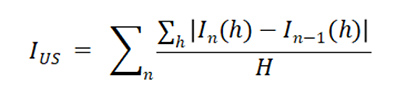
Destabilization can be quantified using the instability index (IUS), whose calculation formula is shown below. The differences between every two consecutive scans are considered in the formula.
Changes in the instability index for different samples are shown in Fig. 4. The larger the instability index is, the less stable the suspension will be. Sample 4 exhibits the smallest instability index throughout the measurement period. Besides, the slope of the change curve of sample 4 is the lowest, indicating the slowest increase in the instability index. It can be inferred from Fig. 4 that TSPP and SDS can not significantly optimize the stability of the suspension. The instability index of sample 3 is even larger than that of sample 1 due to the acceleration of sedimentation. It seems that steric hindrance takes a leading role in stability since large side groups of TWEEN® 80 confer stability despite the high zeta potential of sample 2.
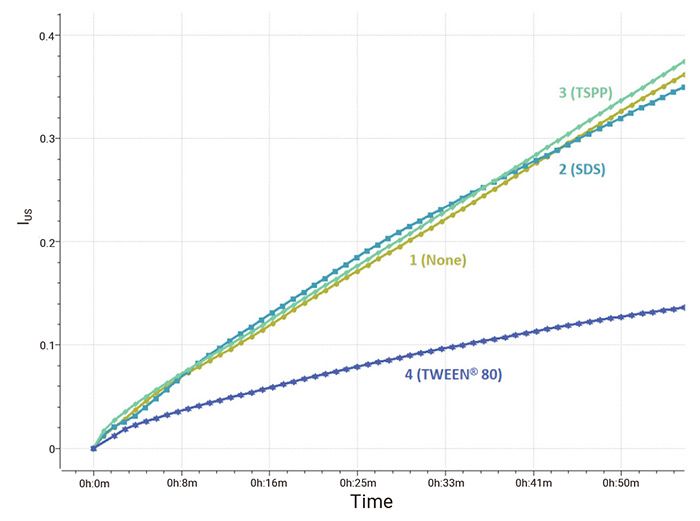
Figure 4: Changes in instability index (IUS) for different samples.
To investigate the effect of the concentration of dispersing agent on the stability of suspension 3 samples with different concentrations of TWEEN® 80 (0.5 wt%, 1.0 wt%, and 2.0 wt% in 20.0 mL of 0.5 wt% suspensions of titanium dioxide nanoparticles) were prepared and analyzed with BeScan Lab. Fig. 5 shows that the stability of the sample with 1.0 wt% TWEEN® 80 is the highest, with IUS = 0.13 after 1 hour of measurement. Samples with 0.5 wt% and 2.0 wt% TWEEN® 80 exhibit similar instability indices.
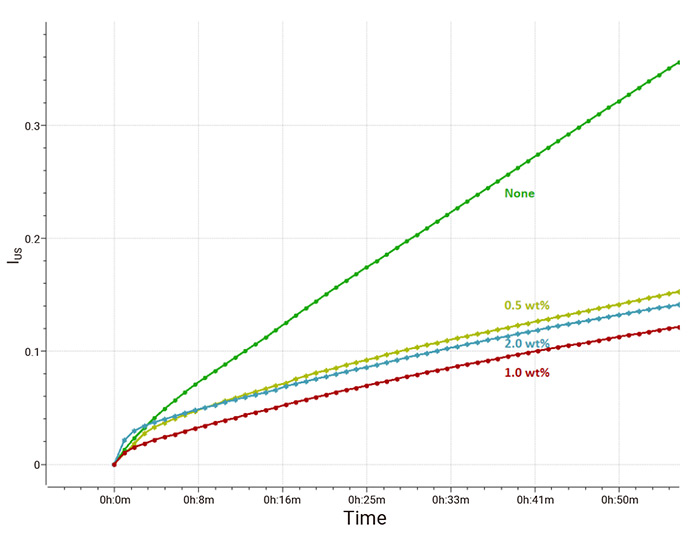
Figure 5: Changes in instability index (IUS) with different concentration of TWEEN® 80.
Conclusion
In this study, various dispersing agents were added to the suspensions of titanium dioxide nanoparticles for stability analysis, among which TWEEN® 80 improves the stability of suspension to the greatest extent. The study also shows that the optimal concentration of TWEEN® 80 is 1.0 wt%, based on the known results.
About the Authors
 |
Wenjian Zhou Application Engineer @ Bettersize Instruments |
 |
Xin Yan Application Engineer @ Bettersize Instruments |
|
BeScan Lab Stability Analyzer
|
 |
Recommended articles
Rate this article