
Investigating Beer Foam using BeScan Lab
2024-07-12Application Note
BeScan Lab enables qualitative analysis for beer foam, in which variations of light transmission can be easily captured to generate corresponding spectrum. Quantitative analysis based on hydrodynamics and instability index demonstrates a stable beer foam with low alcohol content and proper wort concentration.
| Product | BeScan Lab |
| Industry | Food and Drink Analysis |
| Sample | Beer |
| Measurement Type | Stability |
| Measurement Technology | Static Multiple Light Scattering (SMLS) |
Jump to a section:
Introduction
Beer foam generated by malt proteins, yeast, hops, and carbon dioxide is considered a significant element contributing to freshness and quality by beer connoisseurs,[1] providing better flavor and aroma than those made by ancient fermentation processes. The attractive look of the beer foam also leaves a lasting first impression on consumers. Foam quality can be characterized by many properties, including its whiteness, bubble size, retention time, strength, and viscosity, among which stability is a dominant indicator.[2] The difference in beer stability can be traced back to alcohol content, wort concentration, brewing process, and packaging form.
After pouring the beer into the glass, carbon dioxide is released to form beer foam. As time goes on, bubble bursting causes the beer foam to break, reducing the thickness of the foam layer. Besides, droplets between bubbles drain to the interface between the foam and the beer due to gravity. Hence, a new drainage layer forms.
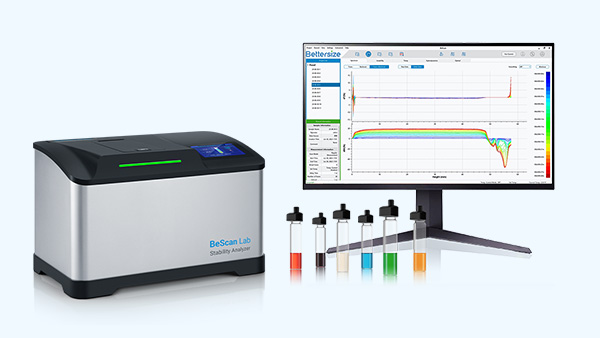
Investigation of beer foam is a necessary topic for manufacturers, which requires a non-invasive, simple, and fast analysis method. BeScan Lab provides a comprehensive solution to qualitative and quantitative analyses of beer foam. Supported by the precise optical path, BeScan Lab can capture slight variations of light transmission and backscattering using forward and backward detectors, offering valuable information concerning changes in the foam.
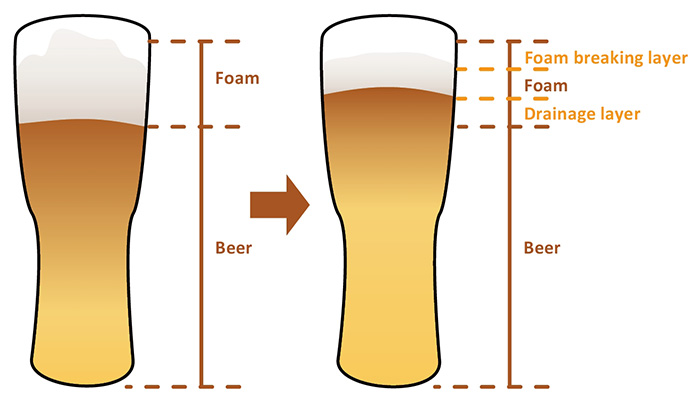
Figure 1: Change in beer foam over time.
Stability Analysis
In this case, six commercial beers were analyzed using BeScan Lab. Ingredients of the beers are listed below in Table 1.
15mL of each sample was added to the sample cell, and then the sample cell was slightly shaken to generate beer foam. The measurements were implemented under 25 ⁰C and the sample scan was carried out every 1 minute. The scan was repeated 20 times to analyze the foam stability.
Table 1: Ingredients of beer samples.
|
Sample |
Alcohol content (vol%) |
Wort concentration (°P) |
Packaging |
|
1# |
3 |
8 |
canned |
|
2# |
3.5 |
10 |
canned |
|
3# |
3.5 |
10 |
bottled |
|
4# |
9 |
18 |
bottled |
|
5# |
4.5 |
11 |
bottled |
|
6# |
5 |
12 |
canned |
Results
Fig.2 shows the foam status before and after measurement. Before measurement, sample 6# exhibits the highest foam height while sample 1# exhibits the lowest foam height. After the measurement, the foam recedes and lacing can only be observed in sample 4#.
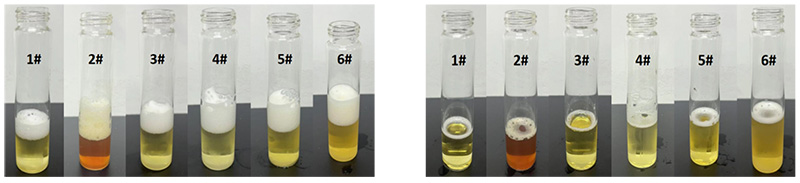
Figure 2: Beer foam status before and after measurement.
The beer is transparent; therefore, light transmission is used for stability analysis. The spectrum shown in Fig.3 demonstrates how transmitted signal varies over time. The transmitted signal is displayed in the form of raw data. It can be seen from the spectrum that the transmitted signal shifts to the left on the far right side. The reason is that the beer foam recedes, which allows more light to pass through the area that was initially filled with dense foam (area ①). The thickness of the foam layer decreases (area ②). Water droplets between foam bubbles drain to the interface between foam and liquid to generate a new drainage layer, causing the transmitted signal to shift to the right. The formation of the drainage layer increases the height of the liquid and expands the area that allows strong light transmission (area ③). An overall increase in transmitted signal on the far left of the spectrum indicates that the beer becomes clearer due to the sedimentation of suspended substances, such as yeast cells and proteins (area ④). The BeScan Lab qualitatively characterizes the beer foam, in which the related phenomena during the measurement are clearly reflected in the spectrum.
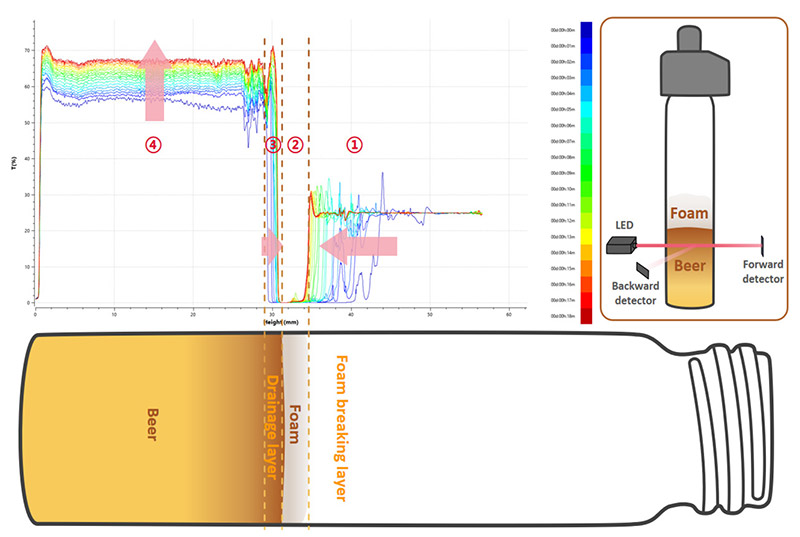
Figure 3: Variation of transmitted signal over time.
Besides, BeScan software provides multiple functions assisting in quantitative analysis. Fig.4 shows the scatter plot based on hydrodynamic analysis, illustrating how fast the drainage layer forms. The Y-axis represents the layer thickness. It can be inferred from the spectrum that the drainage layer thickness of sample 4# is the largest, followed by sample 1#. The larger the drainage layer thickness in the same period becomes, the faster the foam will recede, and the less stable the foam will be. High alcohol content is not beneficial to foam stability, as sample 4#, which has the highest alcohol content, also has the thickest drainage layer. According to the analysis result of sample 4#, high wort concentration can be regarded as an important factor that affects the stability as well. The reason for the unstable foam in sample 1# is low wort concentration. For sample 2# and sample 3#, they have the same alcohol content and wort concentration. However, their analysis results vary. The packaging form is probably a factor, it seems that the beer foam of bottled sample 3# is more stable.
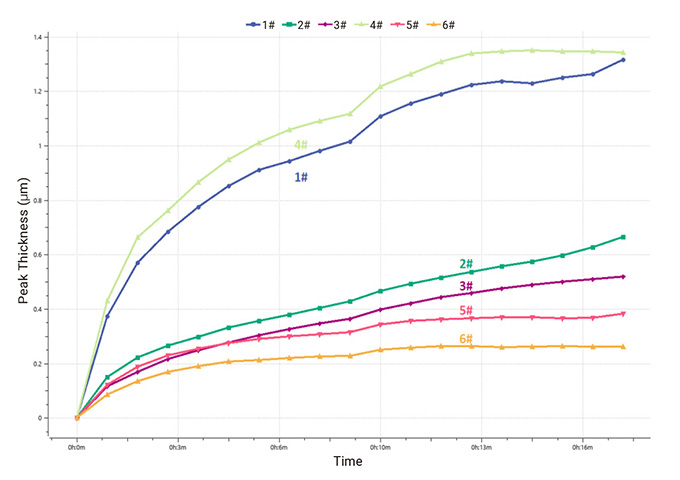
Figure 4: Change curve of drainage layer thickness.
Quantitative analysis offers instability index (IUS), which is calculated by summing the difference of two consecutive scans, the calculation formula is shown below:
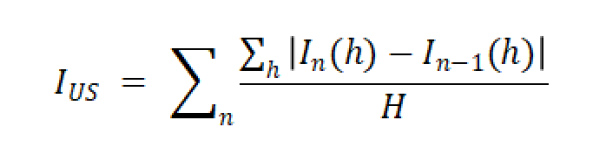
The greater the instability index is, the less stable the dispersion will be. Each scan provides an instability index, and after the measurement, the change curves of the instability index will be compared to each other. As shown in Fig.5, the instability index of sample 4# is the greatest throughout the measurement period, followed by sample 1#, which means sample 4# and sample 1# are relatively unstable systems, corresponding to the measurement results using hydrodynamic analysis. Sample 5# and sample 6# with low alcohol content and proper wort concentration are relatively stable systems since their instability indices change slowly.
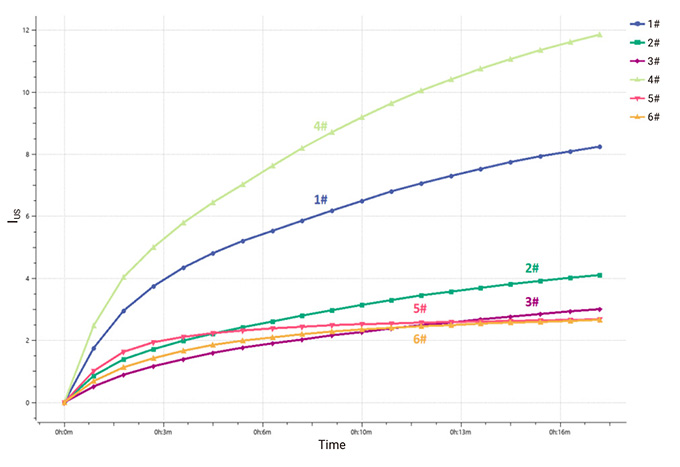
Figure 5: Change curve of instability index (IUS).
Conclusion
BeScan Lab enables qualitative analysis for beer foam, in which variations of light transmission can be easily captured to generate corresponding spectrum. Quantitative analysis based on hydrodynamics and instability index demonstrates a stable beer foam with low alcohol content and proper wort concentration.
Reference
[1] Understanding the science behind Beer Foam. https://byo.com/article/beer-foam-advanced-brewing
[2] Emmanuel K. N.; Hrvoje G.; Kristina H.; Kresimir M.
Determination of Foam Stability in Lager Beers Using Digital Image Analysis of Images Obtained Using RGB and 3D Cameras. Fermentation. 2021, 7(2), 46. https://doi.org/10.3390/fermentation7020046
About the Authors
 |
Xin Yan Application Engineer @ Bettersize Instruments |
 |
Wenjian Zhou Application Engineer @ Bettersize Instruments |
|
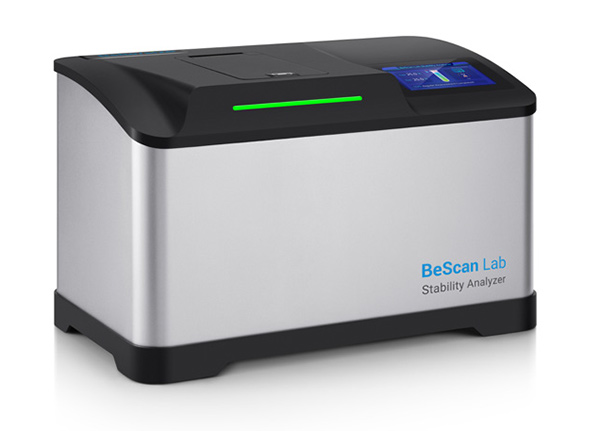
BeScan Lab Stability Analyzer
|
 |
Recommended articles
Rate this article